Trend Intensity Index
This lesson will cover the following
- Explanation and calculation
- How to interpret this indicator
- Trading signals generated by the indicator
Developed by M.H. Pee, the Trend Intensity Index helps determine how strong the current trend is. The stronger the trend, the higher the chance that the price will continue moving in the current direction. A trader will usually enter the market during a strong trend and ride it until the Trend Intensity Index (TII) signals a reversal.
A 30-period TII can be calculated as follows:
First, a 60-period Simple Moving Average needs to be calculated by adding the closing prices for the past 60 days and dividing the result by 60.
Second, calculate the deviation of each of the last 30 closing prices from the 60-day SMA. A deviation is classed as ‘up’ when the closing price is above the SMA, and ‘down’ when the closing price is below it. Up deviations are obtained by subtracting the moving average from the closing price, while down deviations are obtained by subtracting the closing price from the moving average.
The 30-period Trend Intensity Index is calculated as follows:
TII = (SD+) / ((SD+) + (SD-)) × 100, where
– SD+ is the sum of up deviations over the last 30 days
– SD- is the sum of down deviations over the last 30 days
The TII ranges between 0 and 100. A reading above 50 indicates a bullish trend, while a reading below 50 suggests a bearish trend. The further the TII moves away from 50, the greater the intensity of the prevailing trend. Values close to 100 point to a strong bull trend, whereas values near 0 point to a strong bear trend.
If a trader plans to enter a long position tomorrow, the TII must be above 80 during today’s session. Conversely, if a trader plans to enter a short position tomorrow, the TII must be below 20 during today’s session. The position should remain open until the TII signals an entry in the opposite direction.
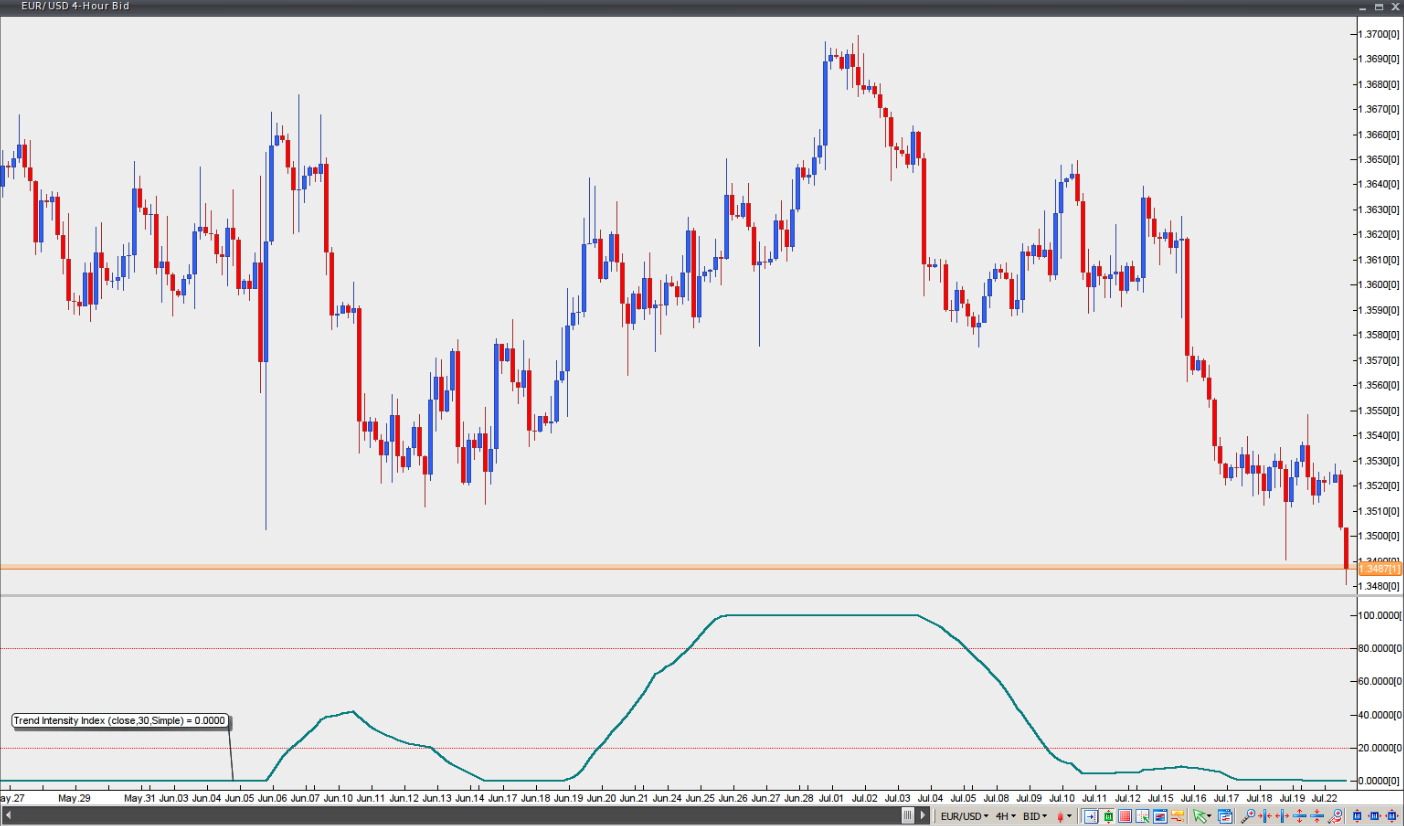
Chart source: VT Trader