Chaikin’s volatility indicator
This lesson will cover the following
- Definition
- Calculation
- Interpretation
Marc Chaikin’s volatility indicator measures market volatility by comparing the spread between a currency’s high and low prices over a specified number of periods. By doing so, it quantifies volatility as the widening of the range between these extreme price levels.
Chaikin’s volatility is essentially the difference between two moving averages of a volume-weighted accumulation-distribution line. Its calculation begins with an exponential moving average (usually with a 10-period look-back) of the difference between the high and low for each period, followed by estimating the percentage change in the exponential moving average over a further n periods (again usually 10).
The latter calculation should look like this: [EMA (H-L) – EMA (H-L n-periods ago)] / EMA (H-L n-periods ago) * 100
Generally, traders use Chaikin’s volatility indicator because rises and dips in its value tend to reflect market sentiment at tops and bottoms, as well as the subsequent lack of enthusiasm among market participants.
The indicator usually peaks sharply ahead of market tops and bottoms, which is often followed by a decline in volatility as market players temporarily lose interest. Low volatility is therefore typical of tight trading ranges.
- Trade Forex
- Trade Crypto
- Trade Stocks
- Regulation: NFA
- Leverage: Day Margin
- Min Deposit: $100
When the market breaks out of the trading range, volatility increases, but the gain is not substantial.
It then tends to register a more significant rise as the price exceeds the most recent high, and a sharp gain is often observed shortly before a new market top. However, as the up-move again enters its exhaustion phase and loses momentum, volatility usually declines markedly, implying that a reversal is likely to occur. You can see the indicator visualised in a trading platform below.
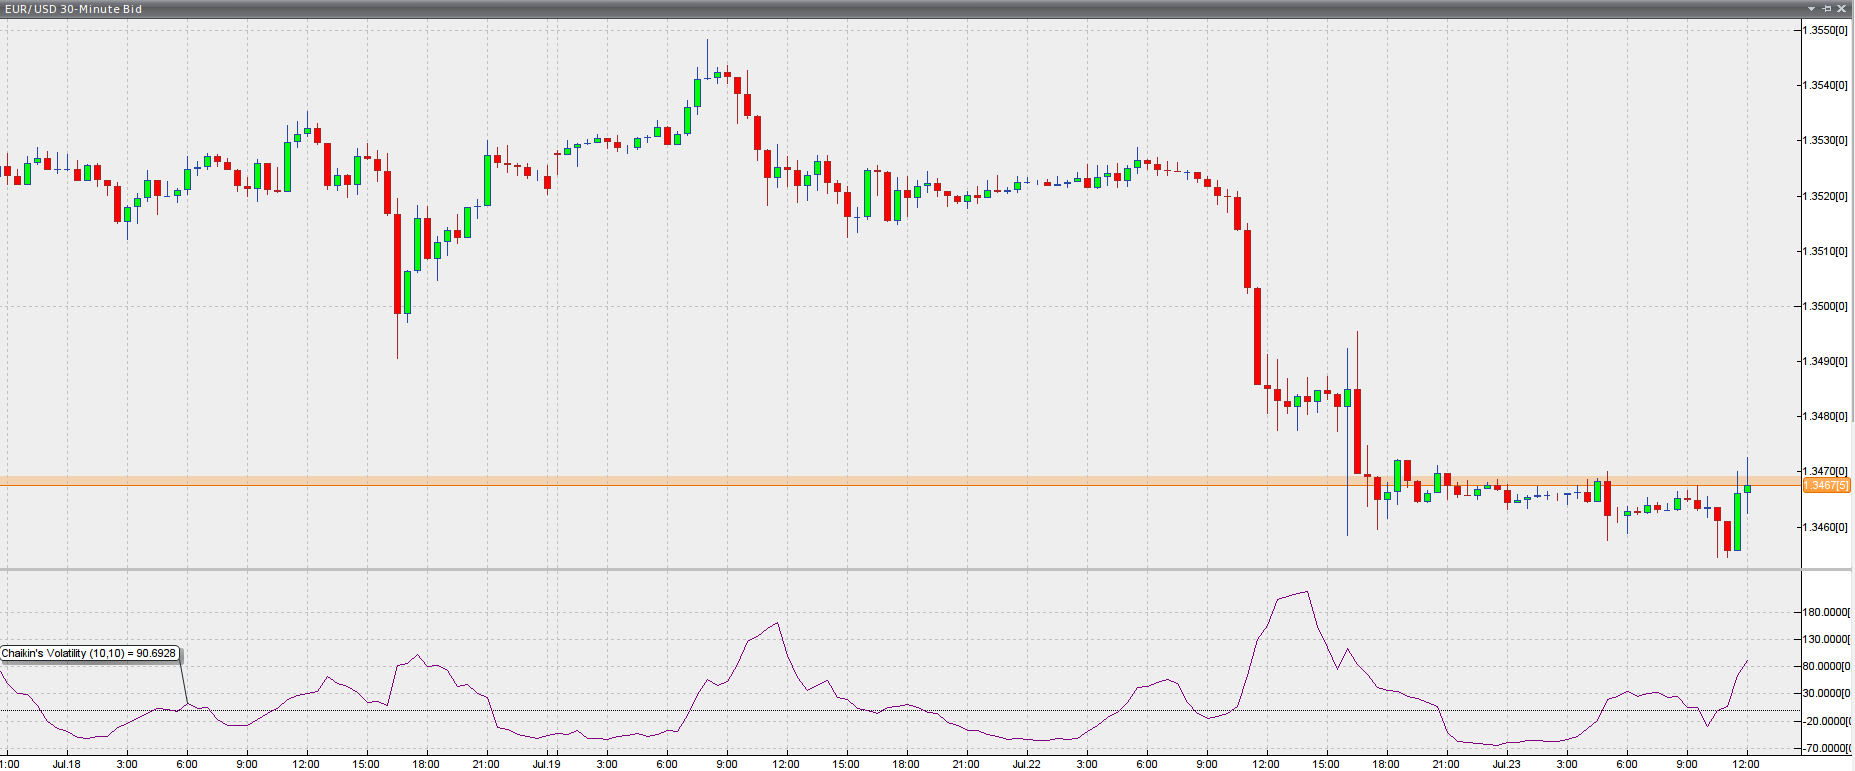
Chart source: VT Trader