R-squared method
This lesson will cover the following
- Explanation and calculation
- How to interpret this indicator
- Trading signals generated by the indicator
This is a linear regression method that attempts to determine the strength of trends. If prices move more closely in a straight line over a certain period, this suggests that the trend is stronger. R-squared readings reflect the percentage of price movement explained by linear regression. If the R-squared reading over 14 periods is 60%, it indicates that 60% of the price movement can be explained by linear regression. The remaining 40% is considered random noise.
A trend is statistically significant for a linear regression line of a given period if we have a 95% confidence level. If the R-squared reading is below the 95% confidence level for a particular period, there is no statistically significant trend.
The recommended number of R-squared periods and the corresponding 95% confidence levels are shown below.
Number of periods / R-squared critical value at 95% confidence:
5 / 77
10 / 40
14 / 27
20 / 20
25 / 16
30 / 13
50 / 8
60 / 6
120 / 3
Linear regression and R-squared can be used in several ways to generate trading signals. One approach combines R-squared with the linear regression slope. R-squared determines how strong the underlying trend is, while the linear regression slope indicates the direction of the trend – whether it is positive or negative. Signals are generated in line with the direction of the linear regression slope, while R-squared should remain above its 95% confidence level.
Another approach combines R-squared with an oscillator. In this case, signals are generated according to the oscillator’s readings between the overbought and oversold levels, while R-squared should remain low (significantly below the 95% confidence level, which suggests that market behaviour is ‘less trendy’).
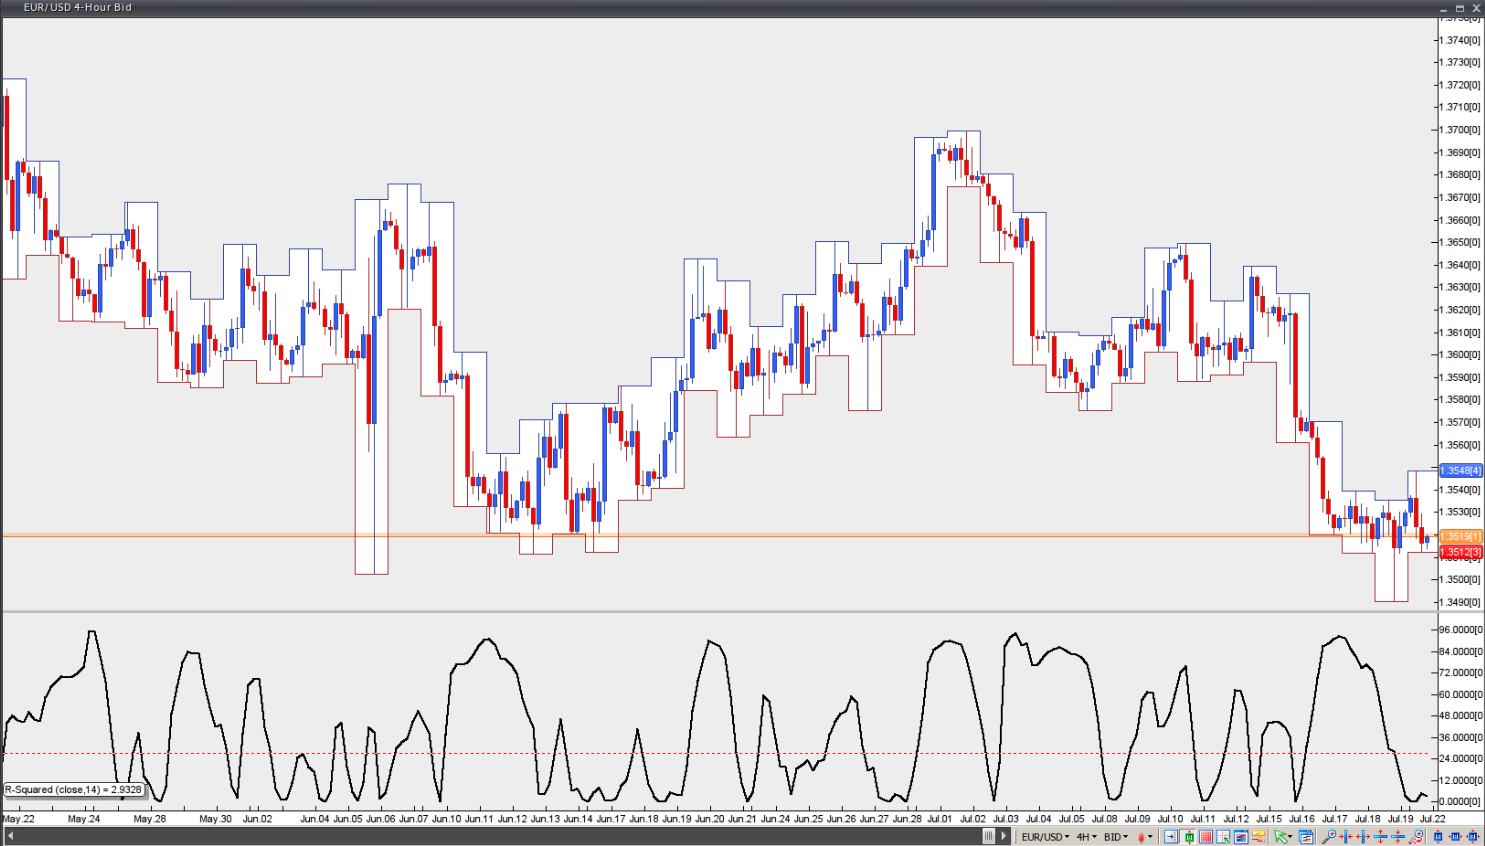
Chart source: VT Trader