Average Directional Movement Index rating
This lesson will cover the following
- Explanation and calculation
- How to interpret this indicator
- Trading signals generated by the indicator
The Average Directional Movement Index Rating (ADXR) is an element of the Directional Movement System, developed by J. Welles Wilder. ADXR quantifies the change in momentum of the Average Directional Index (ADX). This indicator is calculated by adding two values of the Average Directional Index (the current ADX value and the ADX value n periods ago) and then dividing this sum by two, as follows:
ADXR = (ADX + ADX n periods ago) / 2
This additional smoothing means the ADXR responds to changes in trend to a lesser extent than the ADX.
The ADXR is used in the same way as the ADX – the higher the ADXR reading, the more resilient the trend. This indicator enables a trader to determine whether price movement is directional enough to be worth trading. A trend-following strategy can be employed when the ADXR shows a reading above 25. ADXR values above 40 indicate a very strong trending environment, while values below 20 suggest that the market is in a trading range.
- Trade Forex
- Trade Crypto
- Trade Stocks
- Regulation: NFA
- Leverage: Day Margin
- Min Deposit: $100
ADXR is a lagging indicator and will usually provide signals after the ADX does. Some technical analysts prefer to use the ADXR as a signal line applied to the ADX. If the ADX moves above the ADXR, they regard this as a signal to buy. Conversely, if the ADX moves below the ADXR, they view this as a signal to sell.
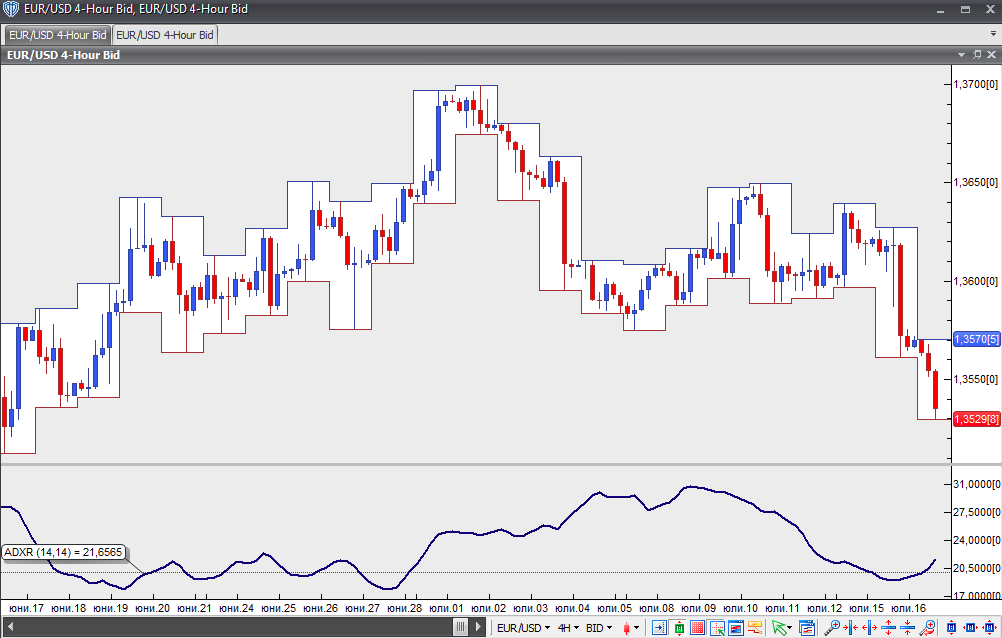
Chart source: VT Trader