Ehlers Relative Vigor Index
This lesson will cover the following
- Explanation and calculation
- How to interpret this indicator
- Trading signals generated by the indicator
The Relative Vigor Index (RVI) was introduced in the January 2002 edition of Technical Analysis of Stocks and Commodities magazine by John Ehlers. The idea behind this indicator is that, during bullish trends, prices tend to close higher than they open, whereas during bearish trends they tend to close lower than they open. Therefore, the vigour (energy) of the move is determined by where prices are at the close.
In order to normalise the RVI to the daily trading range, divide the price change by the day’s maximum price range, as follows:
Relative Vigor Index (1) = (Close-Open) / (High-Low)
To smooth the resulting value, apply a Simple Moving Average (SMA) with a period of 10, producing:
Relative Vigor Index (10) = 10-period SMA of Relative Vigor Index (1)
- Trade Forex
- Trade Crypto
- Trade Stocks
- Regulation: NFA
- Leverage: Day Margin
- Min Deposit: $100
The RVI generates trading signals when the RVI SMA (blue line on the chart below) crosses the RVI signal line (red line on the chart below). A buy signal is produced when the RVI SMA crosses above the RVI signal line, while a sell signal is produced when the RVI SMA crosses below it.
The RVI does not identify overbought and oversold conditions.
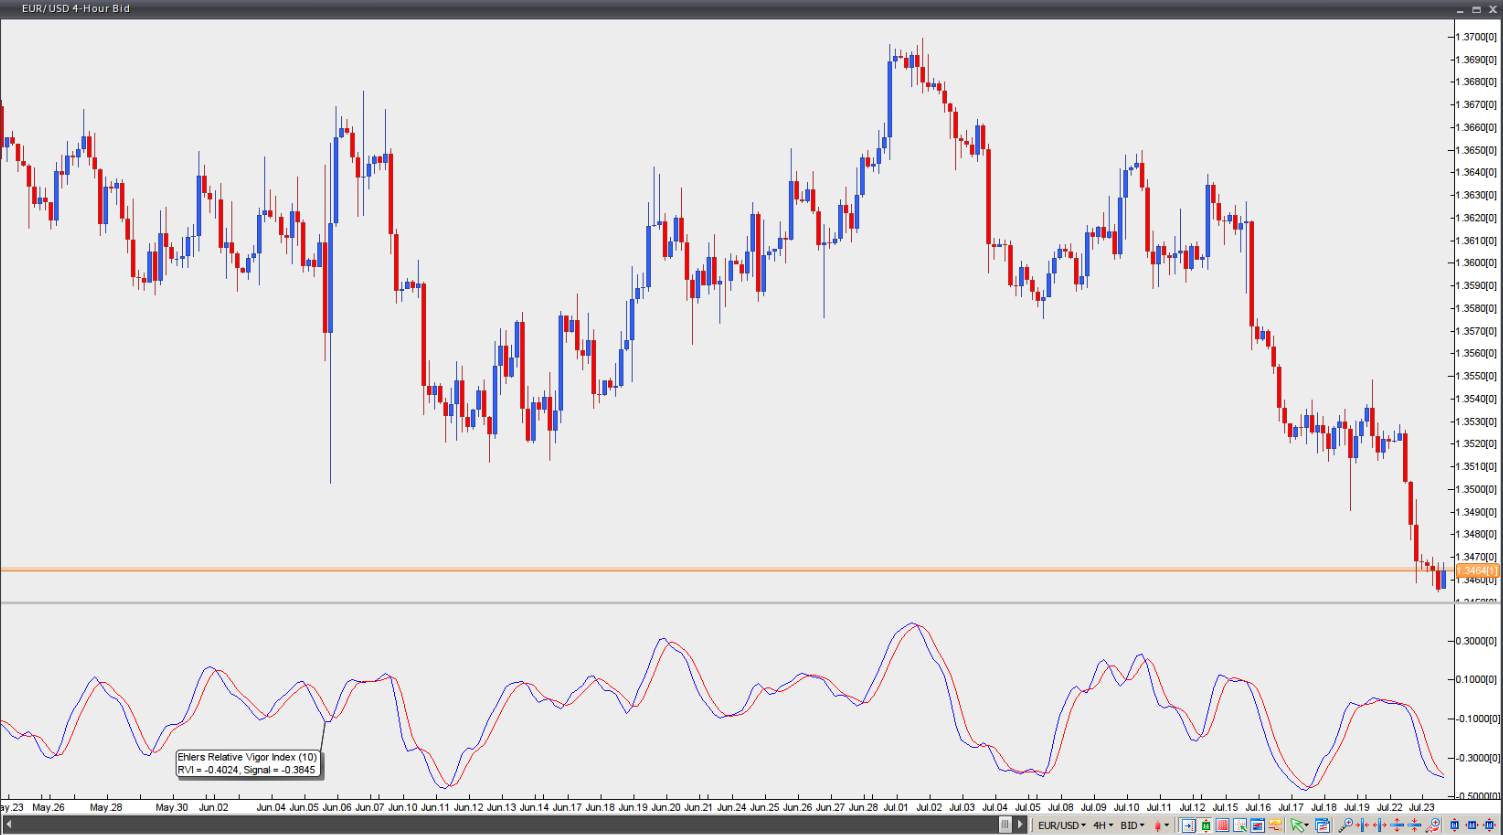
Chart Source: VT Trader