Aroon indicator
This lesson will cover the following
- Explanation and calculation
- How to interpret this indicator
- Trading signals generated by the indicator
This indicator was developed by Tushar Chande in 1995, and its main objective is to identify whether a particular trading instrument is in a trend and how strong that trend is. Because the indicator is designed to detect the beginning of new trends, Chande called it ‘Aroon’, or ‘dawn’s early light’ in Sanskrit.
The Aroon indicator shows how many periods have passed since the price registered an n-day low or an n-day high. The indicator consists of two lines, Aroon (Up) and Aroon (Down). Aroon (Up) shows the proportion of time (expressed as a percentage) that has elapsed between the start of the period and the moment the highest price level within that period was reached. If the instrument records a new bottom during the examined period, Aroon (Up) will be zero. If the instrument closes at a new high for the period, Aroon (Up) will be +100. During every subsequent period that passes without a new peak being set, Aroon (Up) will decrease by (1/number of periods) × 100.
Aroon (Down) will be zero if the trading instrument records a new peak during the examined period. Aroon (Down) will be +100 if the instrument closes at a new low for the period.
Aroon (Up) is calculated as follows:
Aroon (Up) = [[(number of periods) − (number of periods since the highest peak during that time)] / (number of periods)] × 100
Aroon (Down) is calculated as follows:
Aroon (Down) = [[(number of periods) − (number of periods since the lowest bottom during that time)] / (number of periods)] × 100
- Trade Forex
- Trade Crypto
- Trade Stocks
- Regulation: NFA
- Leverage: Day Margin
- Min Deposit: $100
Let us consider an example. On a daily chart we set a 20-day Aroon (Up) line. If the highest price level during the past 20 days was reached 8 days ago (or 12 days after the start of the period), Aroon (Up) for the current trading day would be ((20−8)/20) × 100, or 60. If the lowest price level during the past 20 days was reached 2 days ago, Aroon (Down) for the current day would be ((20−2)/20) × 100, or 90.
Aroon (Up) and Aroon (Down) move within a range of 0-100 and oscillate around the centreline at 50. Buyers have the advantage when Aroon (Up) stays above 50 and Aroon (Down) stays below 50. Sellers have the advantage when Aroon (Up) stays below 50 and Aroon (Down) stays above 50. If one of the indicators rises to 100, this signifies that a new trend may be beginning. At the same time, the other Aroon indicator needs to be falling. For example, if Aroon (Up) is close to 100 while Aroon (Down) is below 30, this indicates that the bulls are strong.
There are usually three stages indicating that a new trend is probably beginning: 1) the Aroon lines cross; 2) they cross below or above the centreline at 50; 3) one of the lines reaches 100. For a bullish signal, the first stage is when Aroon (Up) moves above Aroon (Down); the second stage is when Aroon (Up) moves above the centreline and Aroon (Down) moves below it; the third stage is when Aroon (Up) comes close to 100 and Aroon (Down) remains at low levels.
Aroon lines can also indicate a consolidating market when both indicators remain below the centreline or when they move lower in parallel.
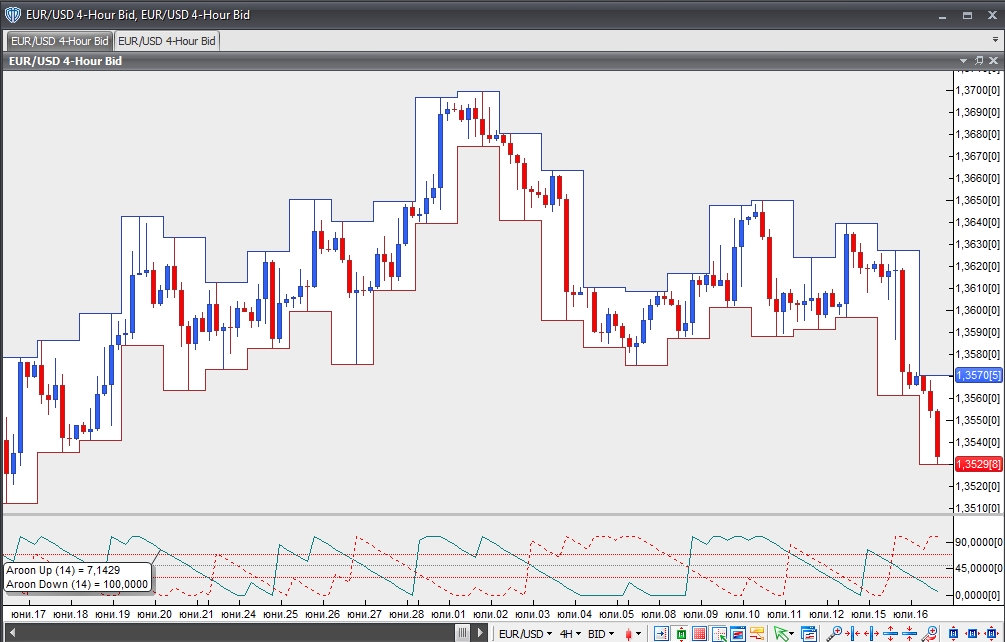
Chart Source: VT Trader