Percentage price oscillator
This lesson will cover the following
- Explanation and calculation
- How to interpret this indicator
- Trading signals generated by the indicator
The Percentage Price Oscillator (PPO) is a momentum-based oscillator that reflects the difference between two moving averages as a percentage, showing where the fast moving average is relative to the slow moving average. The PPO is similar to the Moving Average Convergence Divergence, except that the latter displays the difference between moving averages as an absolute value. The indicator is visualised as a combination of a signal line, a histogram and a centreline.
It is important to note that Percentage Price Oscillator values are not dependent on the price level of the trading instrument. PPO values for different trading instruments can therefore be compared even when their prices differ significantly.
The Percentage Price Oscillator can be calculated as follows:
PPO = ((12-period EMA – 26-period EMA) / 26-period EMA) x 100
Signal Line = 9-period Exponential Moving Average of PPO
PPO Histogram = PPO – Signal Line
The PPO indicates whether the two moving averages converge or diverge. It is positive when the 12-period EMA is above the 26-period EMA. The further the 12-period EMA moves away from the 26-period EMA, the further the PPO rises into positive territory. Conversely, the PPO is negative when the 12-period EMA is below the 26-period EMA, and it moves deeper into negative territory as the distance between the two EMAs increases.
The Percentage Price Oscillator is mostly used as a trend-following indicator. It generates trading signals in several ways:
First, zero-line crossovers. When the PPO crosses above the zero line, a buy signal is generated; when it crosses below the zero line, a sell signal is generated.
Second, signal-line crossovers. A buy signal is generated when the PPO crosses above the signal line, and a sell signal when it crosses below.
Third, divergences between price and the PPO that may point to a potential trend reversal or trend continuation setup. There are two types of divergence: regular and hidden. Regular divergences signal trend reversals, whereas hidden divergences indicate trend continuation.
A regular bullish divergence occurs when the market forms lower lows while the indicator forms higher lows.
A regular bearish divergence occurs when the market forms higher highs while the indicator forms lower highs.
A hidden bullish divergence occurs when the market forms higher lows while the indicator forms lower lows.
A hidden bearish divergence occurs when the market forms lower highs while the indicator forms higher highs.
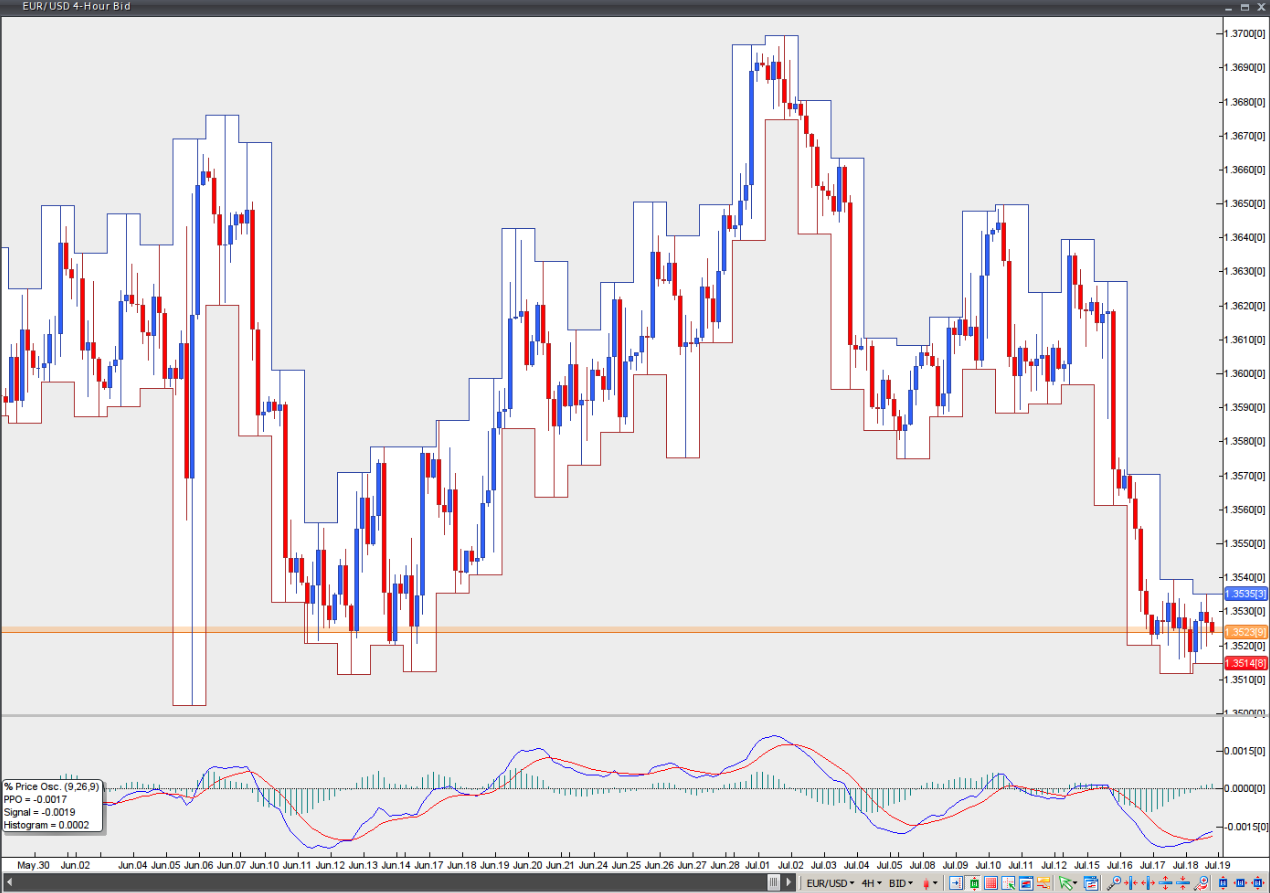
Chart source: VT Trader