Chande’s Quick Stick (Qstick)
This lesson will cover the following
- Explanation and calculation
- How to interpret the indicator
- Trading signals generated by the indicator
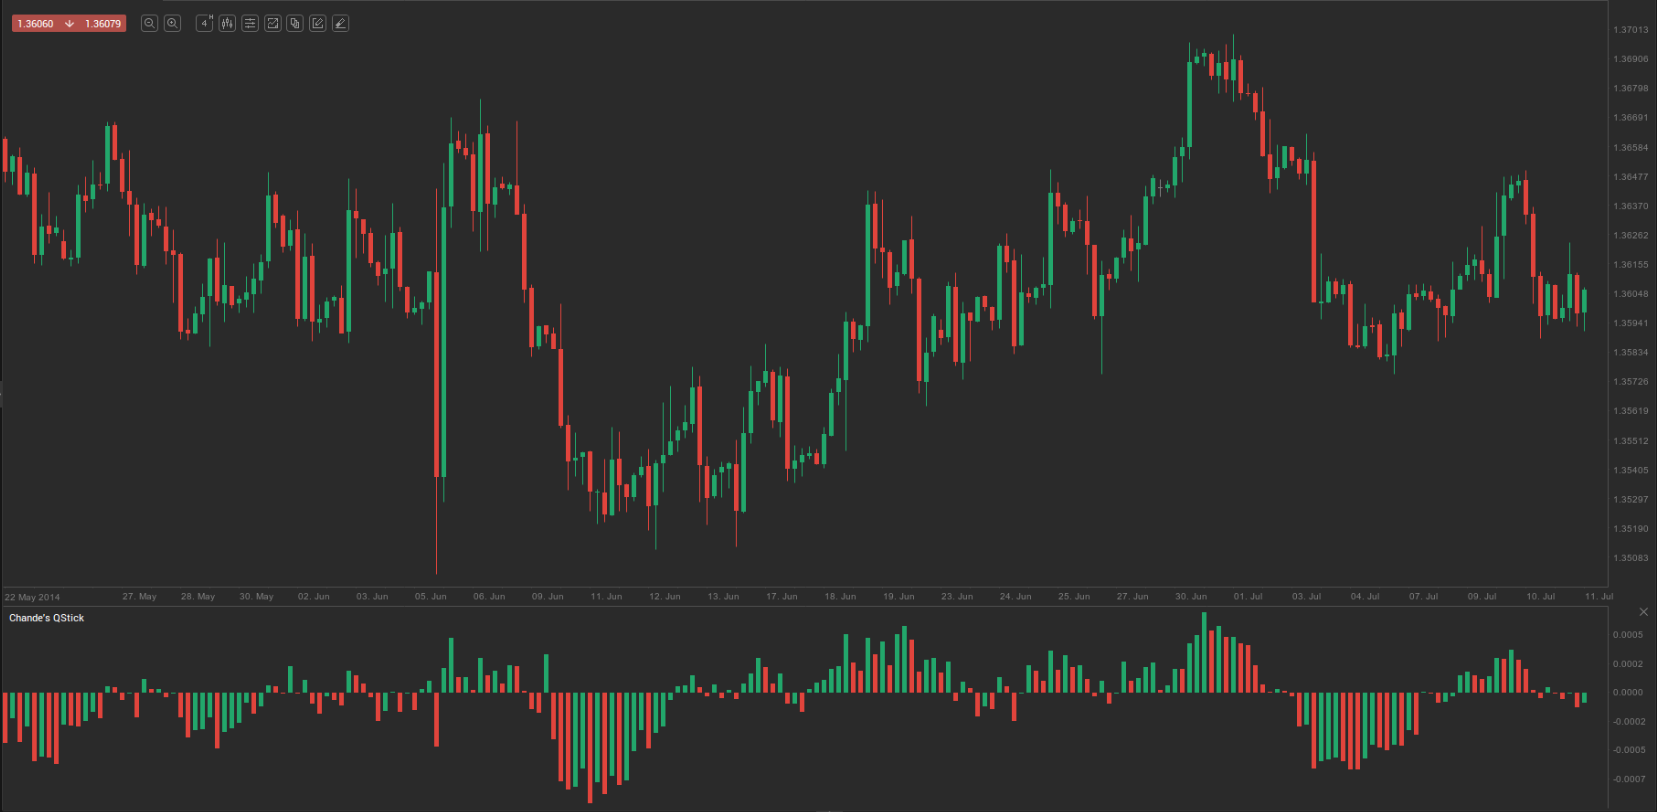
This indicator was designed by scientist, inventor, author and trader Tushar Chande to help identify market trends using candlestick charts.
If the Qstick indicator shows a reading below zero, it indicates that the majority of candlesticks during the examined period are bearish; therefore, the bias for the trading instrument is bearish.
If the Qstick indicator shows a reading above zero, it indicates that the majority of candlesticks during the examined period are bullish; therefore, the bias for the trading instrument is bullish.
There are several ways in which the Qstick can generate trading signals:
First, crossovers of the zero line. If the indicator crosses above zero, it is a signal to buy. If the indicator crosses below zero, it is a signal to sell.
- Trade Forex
- Trade Crypto
- Trade Stocks
- Regulation: NFA
- Leverage: Day Margin
- Min Deposit: $100
Second, look for extreme levels. If the Qstick indicator is at a very low level and begins reversing upwards, it is a signal to buy. If the indicator is at a very high level and begins reversing downwards, it is a signal to sell.
Third, look for divergences. If the market is forming lower lows while the Qstick is forming higher lows, this represents a bullish divergence and is a signal to buy. If the market is forming higher highs while the Qstick is forming lower highs, this represents a bearish divergence and is a signal to sell.