Stochastic Momentum Index
This lesson will cover the following
- Explanation and calculation
- How to interpret this indicator
- Trading signals generated by the indicator
Developed by William Blau and introduced in the January 1993 issue of Technical Analysis of Stocks and Commodities magazine, the Stochastic Momentum Index (SMI) is quicker than the popular traditional Stochastic oscillator and helps traders identify where the current close occurs relative to the midpoint of the recent high-low range, based on price changes within that range.
Raw price differences are then smoothed using a double EMA, or an Exponential Moving Average of the Exponential Moving Average of the raw differences in price. If the closing price is above the midpoint of the range, the Stochastic Momentum Index is positive. If the closing price is below the midpoint of the range, the Stochastic Momentum Index is negative.
Similar to the majority of oscillators, the SMI fluctuates between -100 and +100. There are several ways to use this indicator as a trading signal provider:
First, take advantage of overbought and oversold conditions. An overbought condition occurs when the SMI is at or above +40. An oversold condition occurs when the SMI is at or below -40. Signals are generated when the SMI crosses these extremes. If the SMI crosses below -40 and then moves back above it, a buy signal is generated. If the SMI crosses above +40 and then moves back below it, a sell signal is generated.
Second, look for crossovers between the SMI line and the signal line. A buy signal is generated when the SMI line crosses above the signal line. A sell signal is generated when the SMI line crosses below the signal line. Using this approach, however, may lead to a lower percentage of winning trades. To avoid low-probability signals, a trader may add a neutral zone to the oscillator at -15 and +15. This way, if the trader enters a short position on a crossover that occurs at the overbought level (+40) or above and another crossover then takes place within the -15/+15 neutral zone, he or she will not reverse the position but will instead wait to see how the market reacts to the relative resistance during the current move down. If the market moves through the neutral zone and the trend remains intact, the trader may decide to add to the position or place a tighter stop.
Third, search for divergences between the price and the SMI to identify a potential trend reversal or continuation setup. There are two types of divergence: regular and hidden. Regular divergences signal trend reversals, while hidden divergences signal trend continuation.
A regular bullish divergence occurs when the market forms lower lows while the indicator forms higher lows.
A regular bearish divergence occurs when the market forms higher highs while the indicator forms lower highs.
A hidden bullish divergence occurs when the market forms higher lows while the indicator forms lower lows.
A hidden bearish divergence occurs when the market forms lower highs while the indicator forms higher highs.
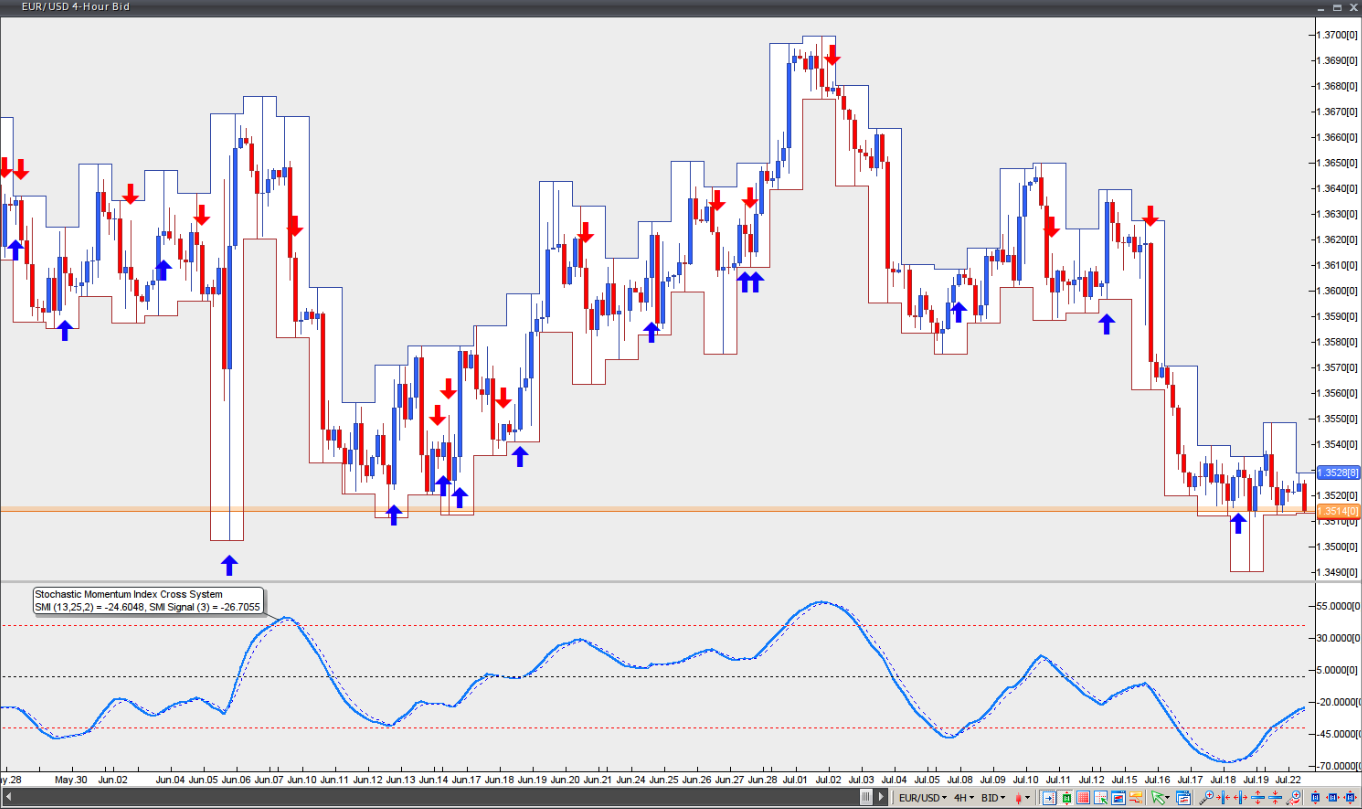
Chart source: VT Trader