Written by ,  | Updated:
Kurtosis indicator
This lesson will cover the following
- Explanation and calculation
- How to interpret this indicator
- Trading signals generated by the indicator
This indicator is designed to identify market sentiment. It is calculated in three stages:
– The Kurtosis component is calculated as follows:
K = n-period momentum of the current bar minus the n-period momentum of the previous bar.
– The Fast Kurtosis component is calculated as follows:
FK = n-period moving average of K.
– The Fast/Slow Kurtosis component is calculated as follows:
FSK = n-period moving average of FK.
Trading signals are generated when the Kurtosis indicator crosses its zero line. A buy signal is generated when the indicator crosses above the zero line. A sell signal is generated when the indicator crosses below the zero line.
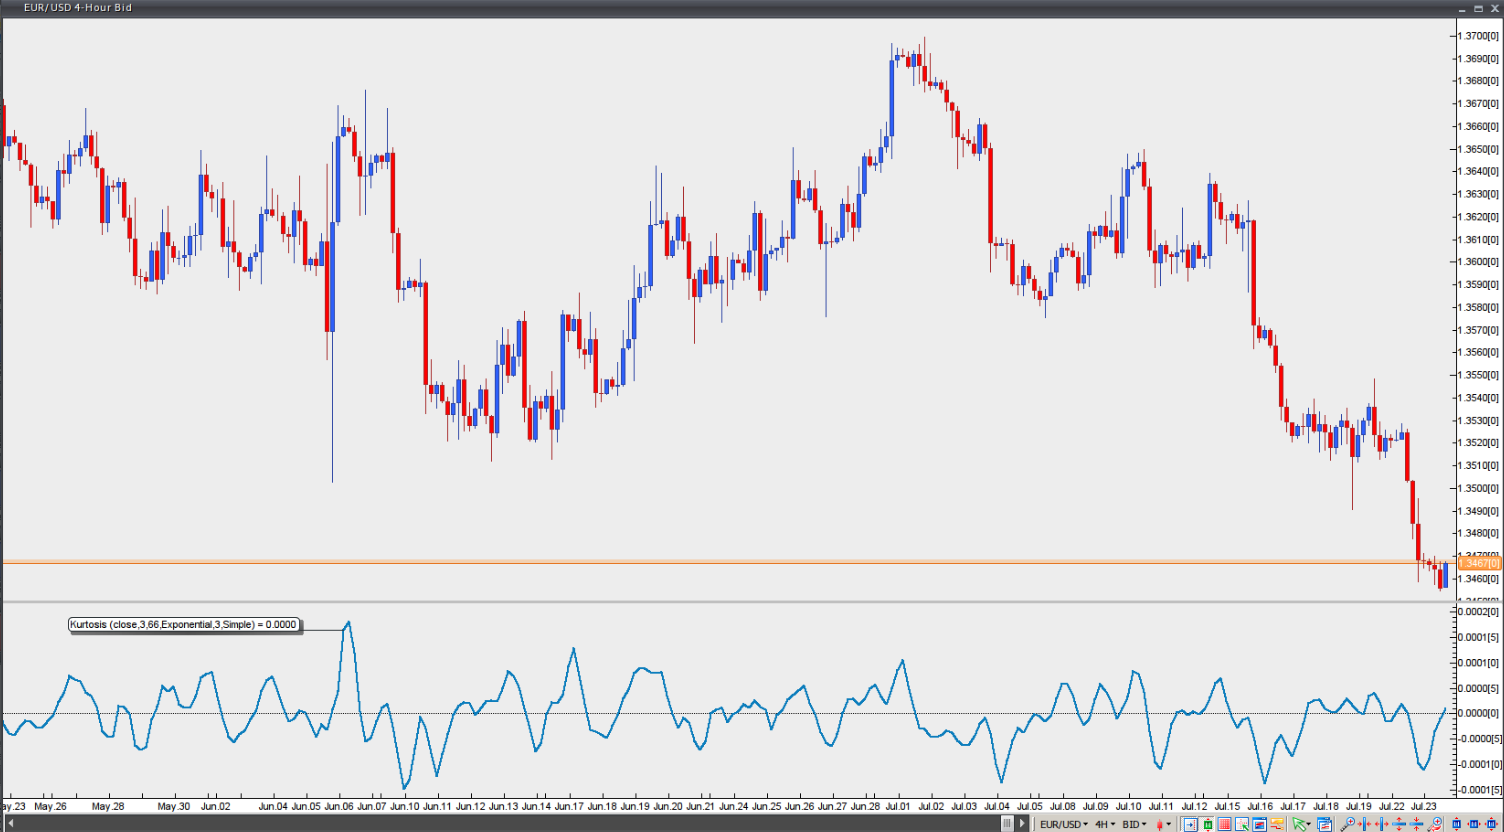
Chart Source: VT Trader