Mass Index
This lesson will cover the following
- Definition
- Calculation
- Interpretation
Developed by Donald Dorsey, the Mass Index is a volatility indicator that uses the expansion or contraction of the price’s high-low range to identify trend reversals. It rises as the average price range (the difference between the highs and lows) grows, and declines as the price range narrows. However, because the Mass Index takes into account only volatility, it has no directional bias; therefore, it serves solely to signal possible trend reversals.
 The calculation of the Mass Index involves four steps and is based on a single EMA, a double EMA (an EMA of the first EMA), the ratio between the two, and a final 25-day moving sum of that ratio. Below you can see the full list of actions needed to estimate the Mass Index:
1. Calculate the single Exponential Moving Average as a 9-period EMA of the price’s high-low differential.
2. Calculate the double Exponential Moving Average as a 9-period EMA of the 9-period EMA of the high-low differential (essentially a 9-period EMA of the EMA in point 1).
3. Calculate the EMA ratio by dividing the single EMA by the double EMA (the EMA in point 1 divided by the EMA in point 2).
4. Calculate the Mass Index as a 25-period moving sum of the EMA ratio.
Essentially, the single EMA provides the average for the high-low range, which is then smoothed a second time by the double EMA. The ratio between the two normalises the data and shows when the single EMA rises relative to the double EMA, while the final 25-period moving summation further irons out the data.
Logic
 The logic behind this indicator is that surging volatility often accompanies directional shifts; thus, a spike in the indicator’s value should be regarded as a possible upcoming trend reversal. However, there must be a certain threshold that distinguishes ‘normal’ volatility from ‘excessive’ volatility and, in turn, generates an entry signal when the latter occurs.
The indicator usually ranges around the mid-20s. According to its creator, the Mass Index’s most important key point and entry level is when its value exceeds 27 and then drops back below 26.5 (when you are using a 25-period sum of the EMA ratio). Here is how the indicator and the pattern look.
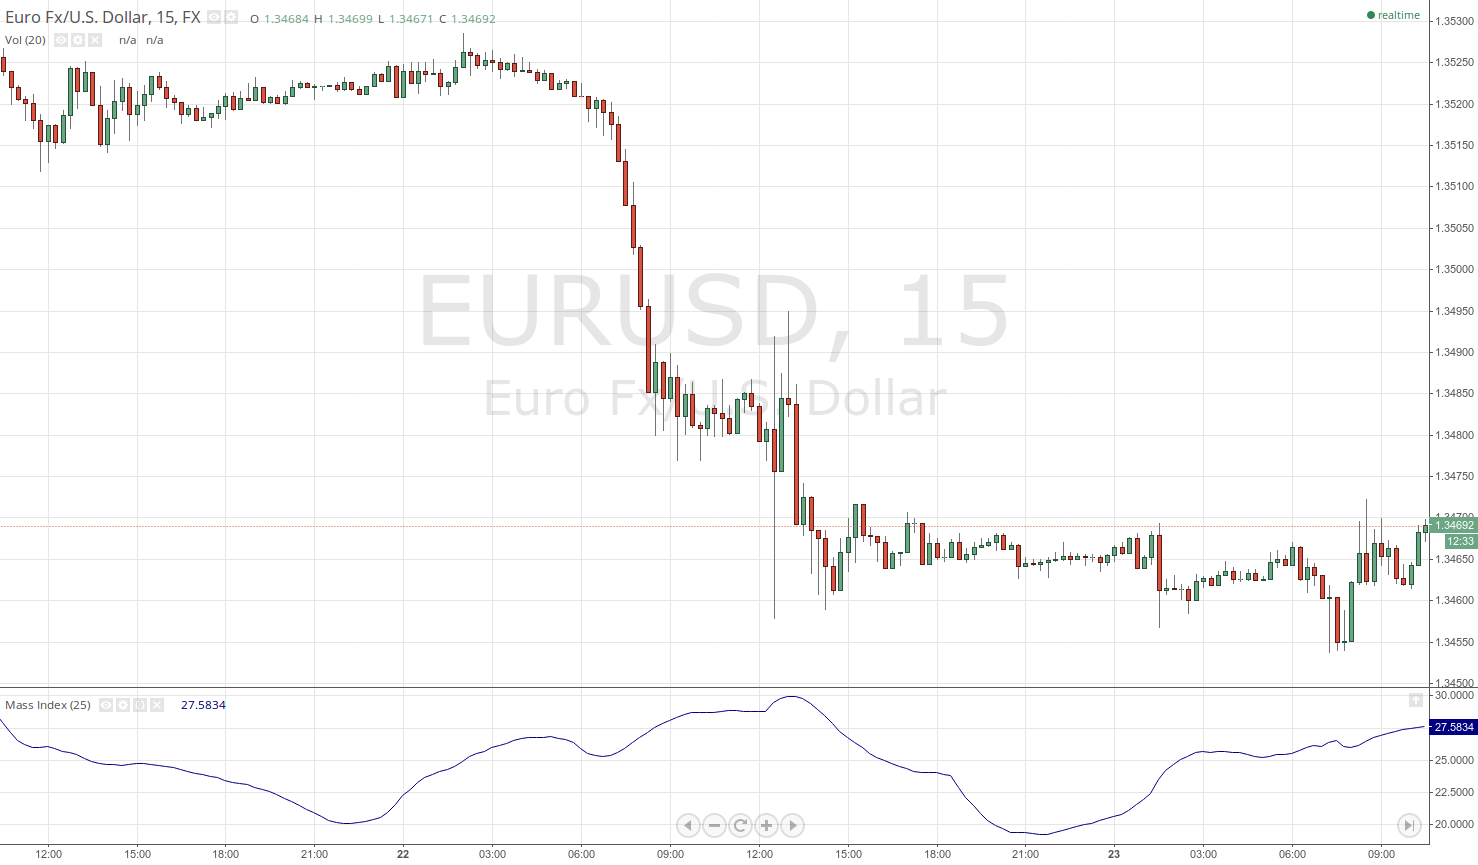
The logic behind this move, which Dorsey refers to as the ‘reversal bulge’, is that the market has made a sufficiently steep move in one direction (thus exceeds 27, regarded as a buy/sell climax) and then stands a higher chance of reversing or at least retracing. As soon as the reversal occurs and is confirmed by the indicator dropping below 26.5, an entry signal is generated in the direction of the new trend.
However, using the Mass Index alone to decide whether to trade against the old trend and in the direction of the supposedly new one is unwise. Once the reversal bulge is complete (the Mass Index retreats below 26.5), the trader should employ other technical analysis tools to confirm the direction of the new move and whether it is strong enough to reverse the previous trend. In some cases, the indicator’s length may need tweaking, as a threshold of 27 may be too high during periods of low volatility. Under such conditions, the Mass Index will hardly produce any signals, so different markets may require adjustments.