Ehlers Fisher transform
This lesson will cover the following
- Definition
- Interpretation
Developed by John Ehlers, the Fisher transform is a leading indicator designed to identify major price reversals and visualise them with its distinct, sharp turning points, which mark where the rate of change is greatest.
It is based on the assumption that prices do not follow a normal probability density function (Gaussian PDF), although this is often assumed to be the case. A Gaussian probability density function is the bell-shaped distribution curve in which 68% of samples fall within one standard deviation of the mean.
Because prices do not conform to a Gaussian PDF, the Fisher transformation converts the probability density function (PDF) of each waveform so that the result approximates a Gaussian PDF.
This benefits trading because, when prices are normalised to fall between -1 and +1 and are subjected to the Fisher transform, extreme price movements rarely occur and can therefore be more easily defined. Turning points are sharp and distinct and can be entered with only a minor delay, thus improving the return on successful trades.
- Trade Forex
- Trade Crypto
- Trade Stocks
- Regulation: NFA
- Leverage: Day Margin
- Min Deposit: $100
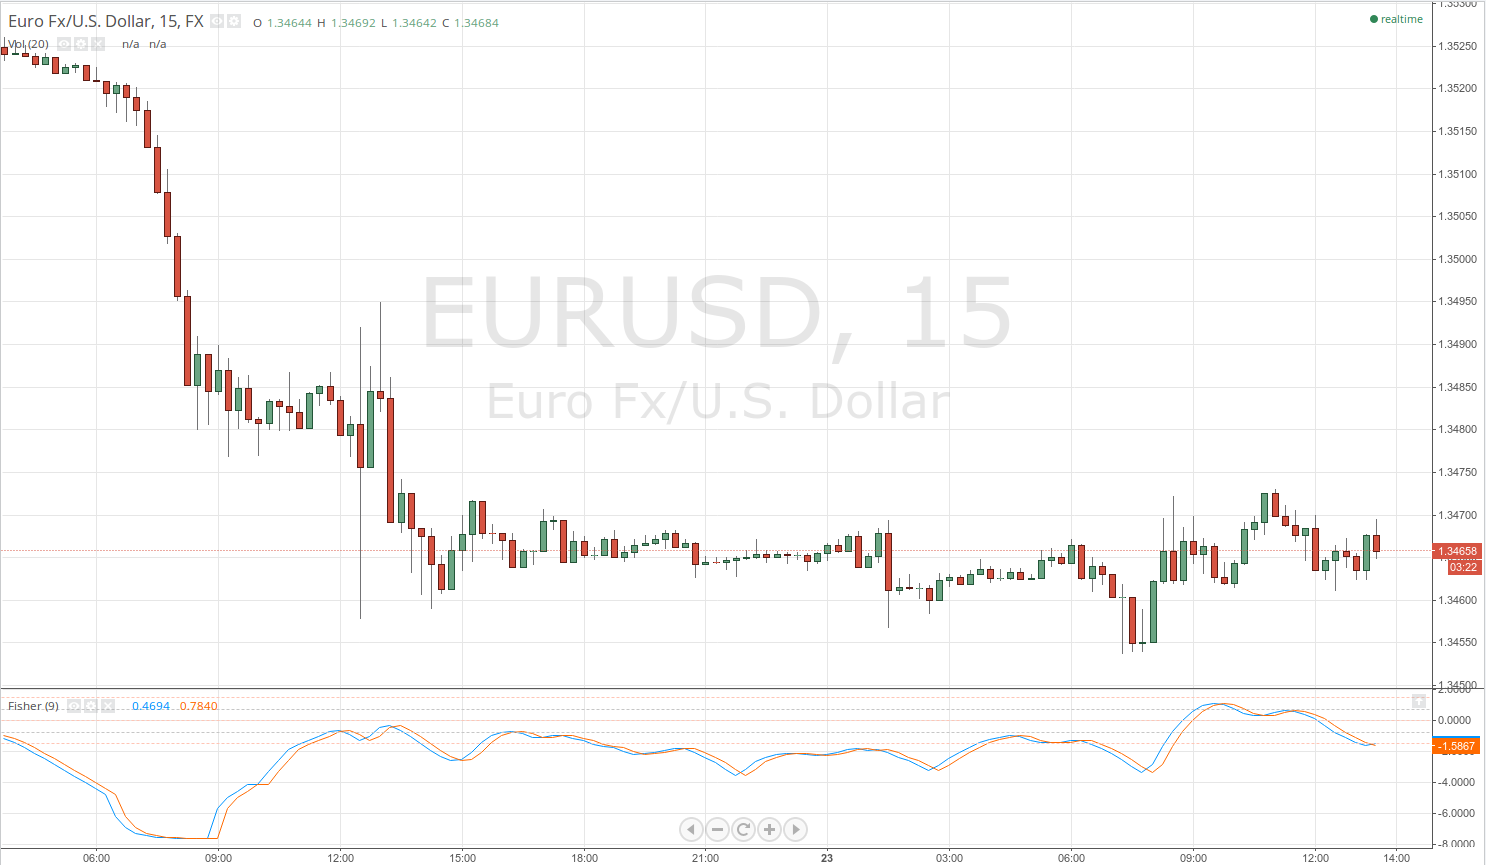
The indicator is visualised by two lines – the Fisher transform line and a signal line – whose crossovers generate entry signals much like the stochastic oscillator’s fast and slow lines. However, like many other indicators, especially leading ones, it is not foolproof and is prone to whipsaws, which generate false signals. Thus, the Fisher transform is best used in combination with other indicators to achieve better performance. An example is posted below.