Recursive moving trend average
This lesson will cover the following
- Explanation and calculation
- How to interpret this indicator
- Trading signals generated by the indicator
This indicator was developed by Dennis Meyers and introduced in his article ‘The Japanese Yen, Recursed’, published in the December 1998 issue of Technical Analysis of Stocks and Commodities magazine. According to Meyers, this method requires only a small amount of historical data for the estimated price and the current price (today) in order to forecast the future price (tomorrow).
Dennis Meyers suggests creating a simple trend oscillator (the ‘tosc’) that represents the difference between the Recursive Moving Trend Average and an Exponential Moving Average (EMA), both calculated over the same period. He proposes examining the price series and searching for changes that exceed the normal noise fluctuations. Such changes signal the start of a potential bull or bear trend.
A potential buy signal is generated when the tosc reading crosses above the ‘dup’ level. A potential sell signal is generated when the tosc reading crosses below the ‘-ddn’ level.
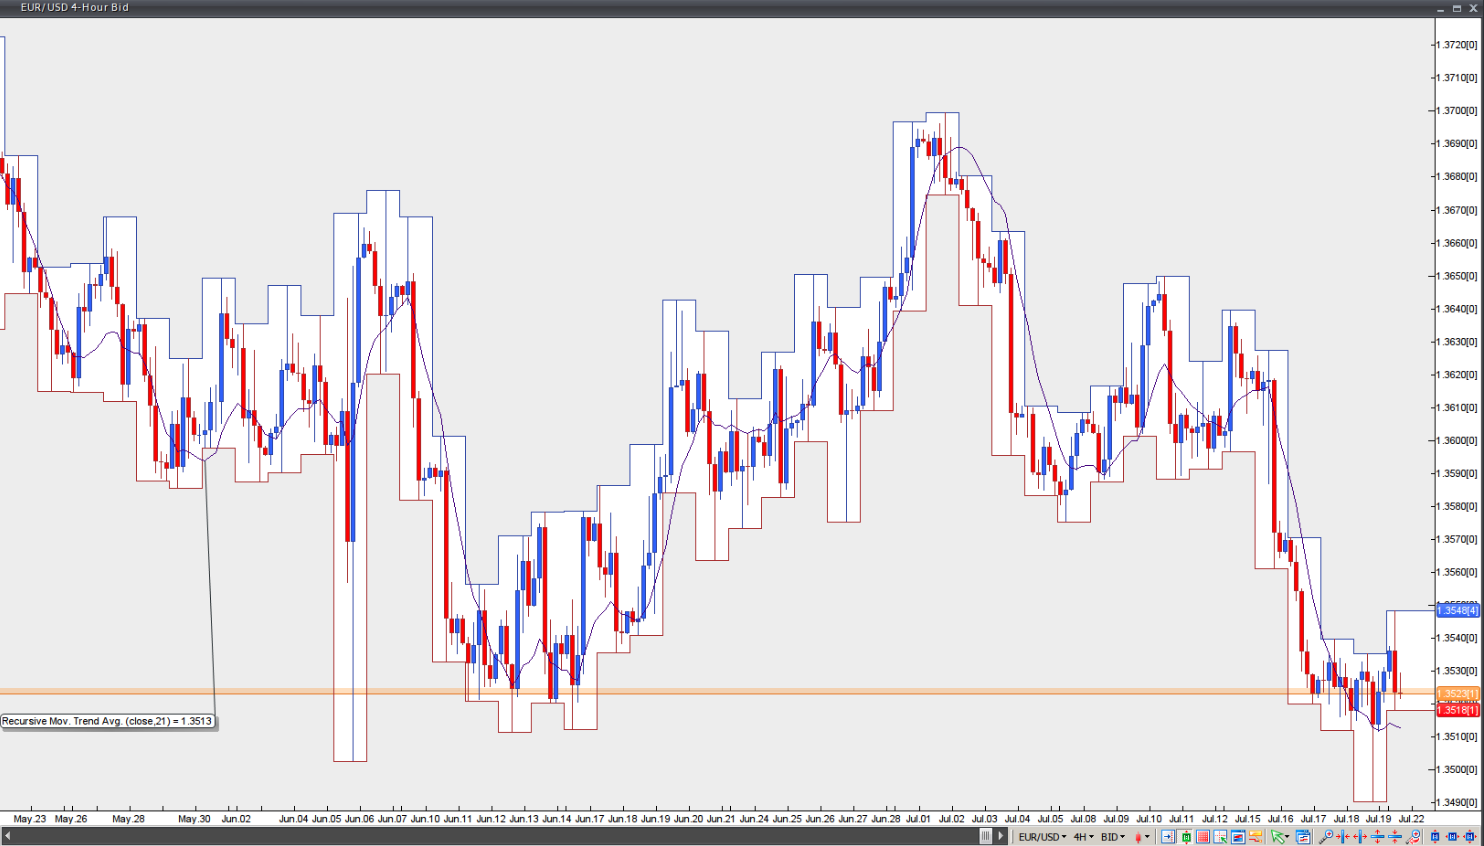
Chart Source: VT Trader