McClellan Summation Index
This lesson will cover the following
- Definition
- Calculation
- Interpretation
Developed by Sherman and Marian McClellan, the McClellan Summation Index is a breadth indicator that builds upon the McClellan Oscillator, which itself is a breadth indicator based on the difference between price advances and declines.
The McClellan Summation Index is calculated by adding all the McClellan Oscillator values. Thus, the McClellan Summation Index is used for medium- and long-term trading, while the Oscillator attempts to predict trend reversals or continuations in the short- and medium-term.
The Summation Index generates entry signals when it crosses below or above the zero line. Apart from these crossovers, just like the McClellan Oscillator, trade signals can be derived from bullish and bearish classic and hidden divergences, as well as directional movement and overbought/oversold levels, which can indicate that a reversal has become more likely. Here is what the indicator looks like on a trading platform.
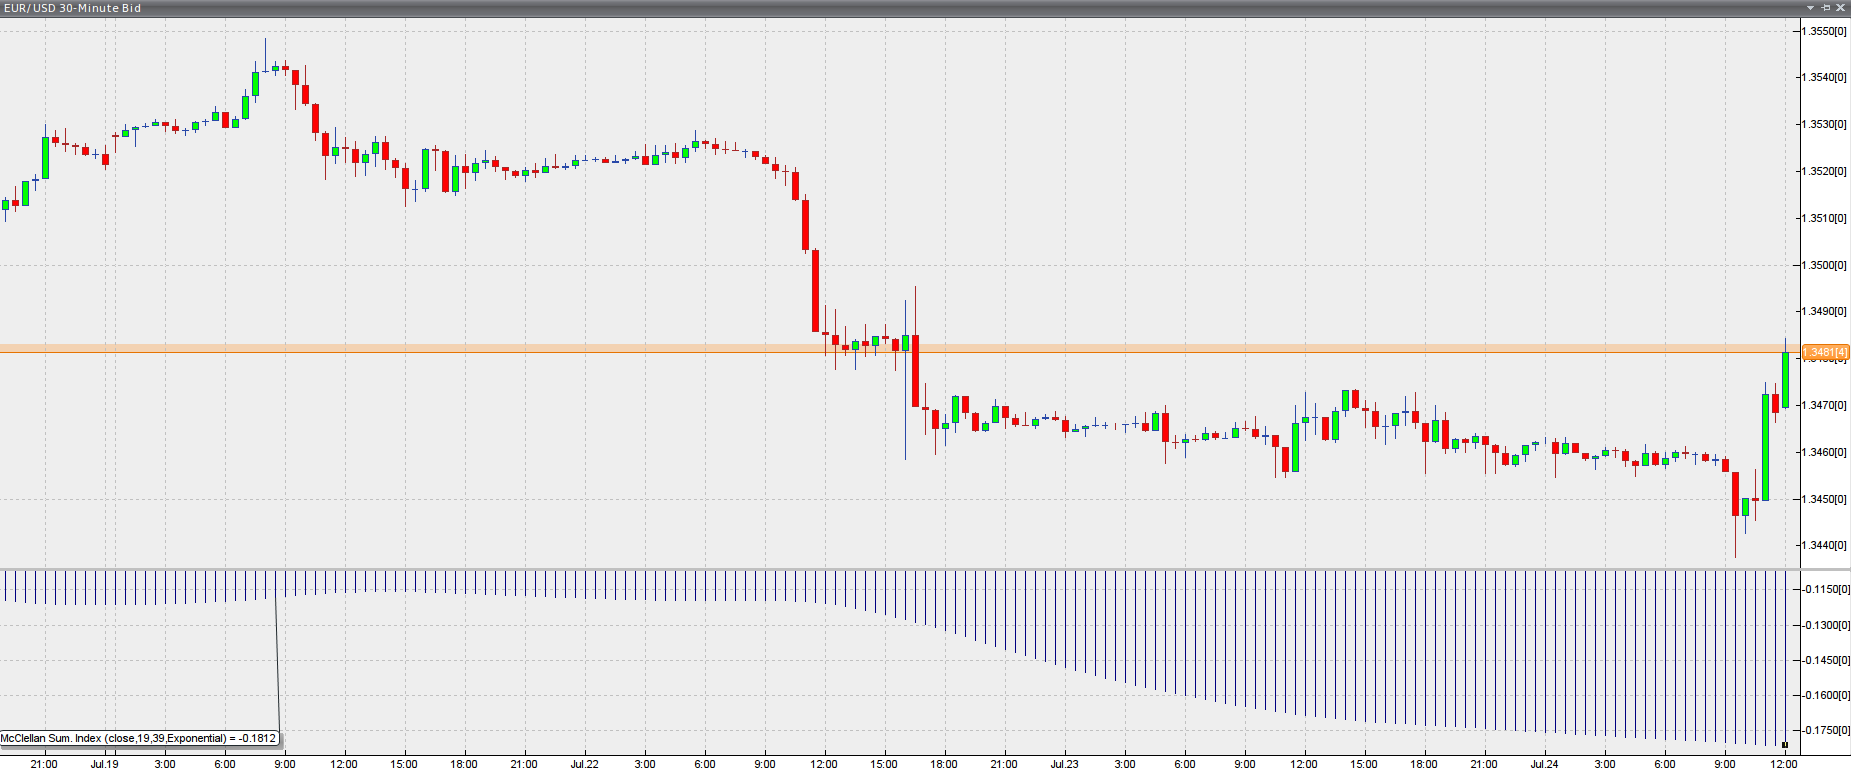
Chart source: VT Trader
Calculation
 We said that the Summation Index is the running total of the McClellan Oscillator values. Thus, the formula looks as follows:
McClellan Summation Index = previous period’s Summation Index + current period’s McClellan Oscillator.
Note that the first Summation Index equals the value of the McClellan Oscillator for the respective period.
Due to the way it is calculated, we can logically reach the conclusion that the Summation Index is a slower variety of the McClellan Oscillator. As such, it will move more smoothly than the Oscillator, will cross the zero line fewer times and will form divergences less frequently.
The Summation Index will rise when the McClellan Oscillator is positive and will decline when the Oscillator is negative. However, because the Summation Index is much slower than the Oscillator, the latter will need to record a certain number of positive or negative readings to push the Summation Index above or below the zero line and keep it there. Thus, extended moves by the Oscillator in either direction will cause the Summation Index to continue trending accordingly.
Trading the Summation Index
 Due to its similarity to the McClellan Oscillator, it is traded in the same way. Traders also closely watch both classic and hidden divergences between the indicator and the price, as well as overbought and oversold conditions. Divergences often precede moves in the indicator, but a divergence alone is not reliable enough to open a position; further analysis with the help of other tools is required. At the very least, a divergence needs to be confirmed by a strong move in that direction, which reverses the previous trend.
A classic bullish divergence is present when the price makes a lower low while the indicator registers a higher low. A classic bearish divergence occurs when the price rises to a higher high, but the indicator only manages to reach a lower high.
A hidden bullish divergence is present when the indicator registers a lower low while the price only drops to a higher low. A hidden bearish divergence is evident when the Oscillator registers a higher high while the price is at a lower high.
The McClellan Summation Index can also be combined with a moving average to help identify downturns and upturns. The moving average look-back period depends on the traders’ unique preferences. Also, just as with the Oscillator, zero-line crossovers tend to trigger entry orders in the direction of the crossover.