Detrended price oscillator
This lesson will cover the following
- Definition
- Calculation
- Interpretation
The Detrended Price Oscillator is an indicator that is designed to remove the trend from a price by comparing the price to a prior moving average, thus filtering out cycles longer than the moving average. It identifies cycle highs and lows and estimates their length from peak to peak and trough to trough. This allows the trader to more reliably identify overbought and oversold areas.
The Detrended Price Oscillator does not extend to the last period because it is based on a displaced moving average. It is calculated as follows:
Price (X/2 + 1) periods ago minus the X-period simple moving average.
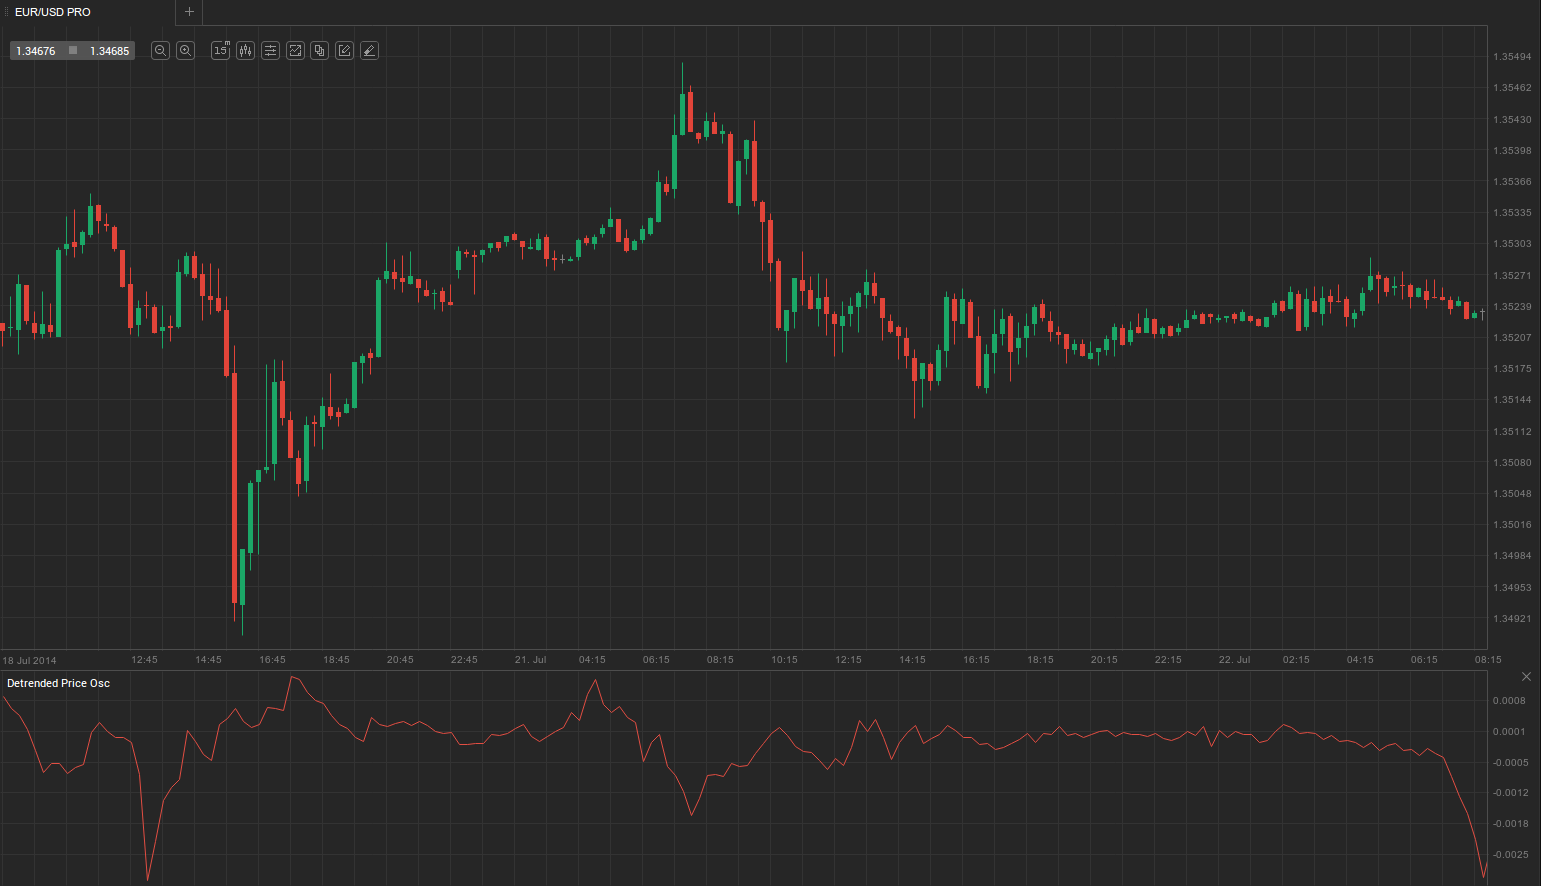
Thus, a 20-day Detrended Price Oscillator that uses a 30-day SMA will be displaced by 30/2 + 1, or 16 days. This moves the 30-day SMA 16 days to the left of your chart, into the middle of the lookback period, thereby centring it. The value of the 30-day SMA is then subtracted from the price in the middle of the lookback period; hence, DPO (30) equals the price 16 days ago minus the 30-day SMA. The screenshot below illustrates how a DPO is plotted in trading software.
The indicator’s cycles are created because it is displaced back in time. For this reason, it is not a real-time indicator and is used only to mark historical highs and lows, which traders can use as entry points within broader trading strategies that include additional indicators.
- Trade Forex
- Trade Crypto
- Trade Stocks
- Regulation: NFA
- Leverage: Day Margin
- Min Deposit: $100
The DPO oscillates above and below zero as prices move relative to the displaced moving average. There are several ways its readings can be interpreted and used.
A trader can go long or short when the Detrended Price Oscillator crosses into positive or negative territory, respectively, thereby following the trend. Go long when the DPO falls below zero, changes direction and climbs back into positive values; conversely, go short when it rises above zero, reverses and drops back into negative territory.
The DPO can also indicate whether the market is overbought or oversold, signalling a possible upcoming reversal; this approach is often used in ranging markets. Set overbought and oversold levels based on past price behaviour. Go long when the DPO enters the oversold area, reverses and crosses back above it. Go short when the DPO becomes overbought, turns lower and falls back below the overbought zone.
Some traders also trade divergences between the price and the DPO: a bullish divergence occurs when the price records a lower low while the DPO falls only to a higher low. Conversely, a bearish divergence arises when the price makes a higher high while the DPO forms a lower high.