Chande’s Dynamic Momentum Index
This lesson will cover the following
- Definition
- Interpretation
Developed by Tushar Chande and Stanley Kroll, the Dynamic Momentum Index measures momentum in a similar manner to the Relative Strength Index.
However, its method of calculation has one key distinction that makes it a unique trading tool – unlike most other momentum indicators that use a static lookback period, the Dynamic Momentum Index automatically adjusts the number of periods considered according to changes in volatility.
Thus, as market volatility spikes, the number of DMI lookback periods is reduced so that the indicator can respond more accurately to the most recent price changes. Conversely, as volatility declines, additional data is included for a better assessment of earlier market developments.
The DMI is interpreted in much the same way as the more widely used Relative Strength Index. Readings above 70 on its scale are regarded as overbought and imply, though not always, that the price might reverse or at least retrace soon, while values below 30 suggest the market is oversold and a bullish reversal or retracement might be imminent. The screenshot below shows how the indicator is visualised in trading software.
- Trade Forex
- Trade Crypto
- Trade Stocks
- Regulation: NFA
- Leverage: Day Margin
- Min Deposit: $100
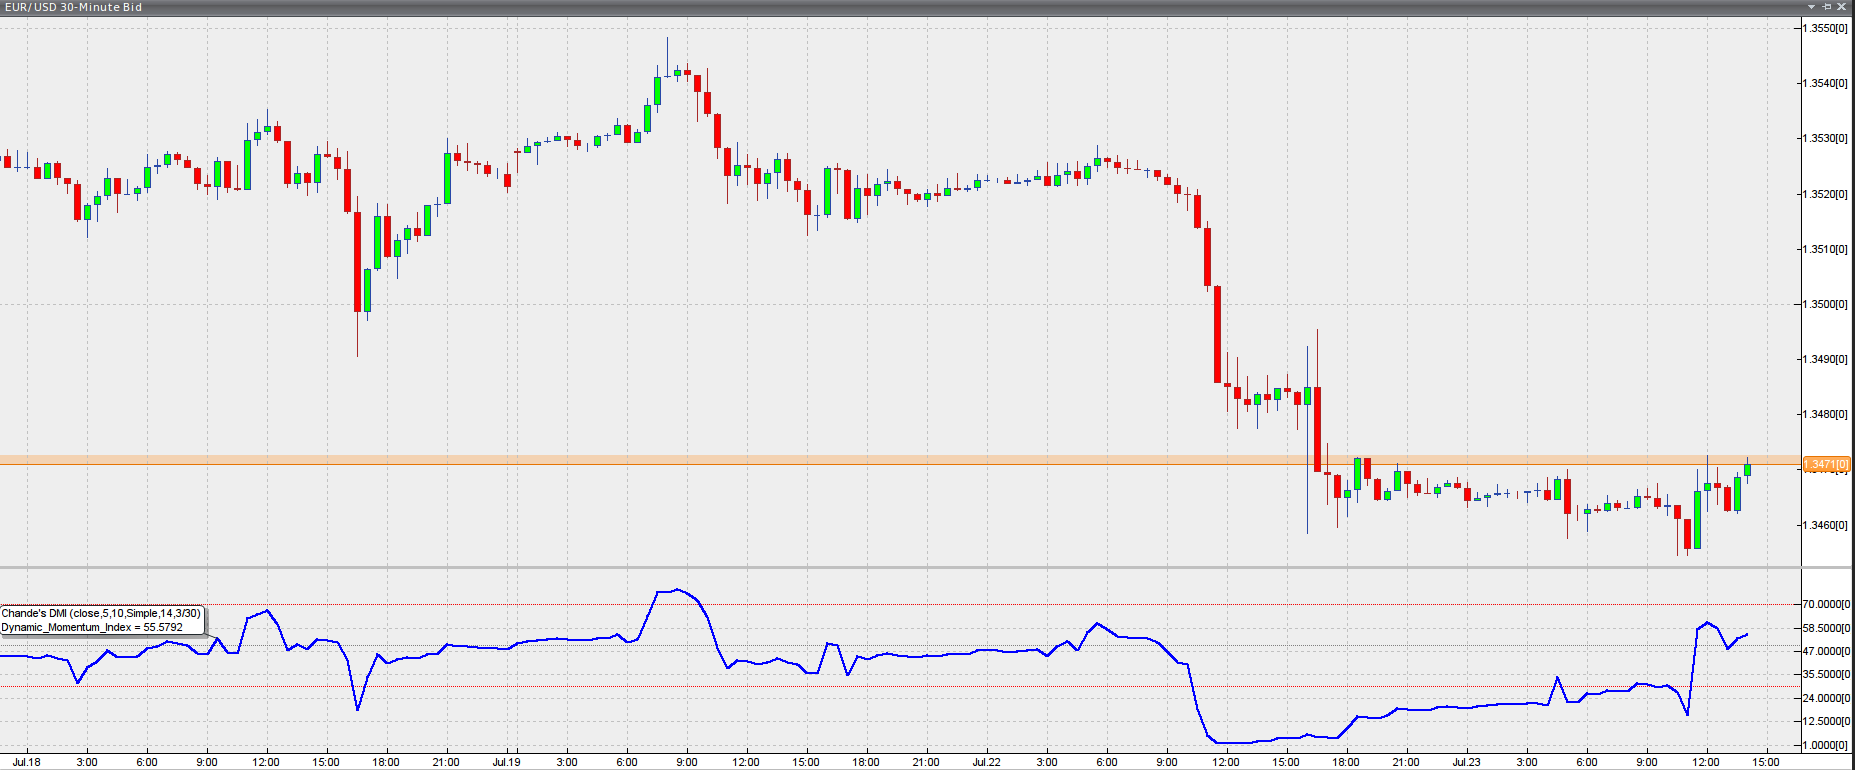
Chart source: VT Trader
Apart from trading the overbought/oversold signals, of course in conjunction with confirmation from other trading tools, we can also use the Dynamic Momentum Index to enter the market on divergences with the financial instrument’s price. This is done according to the same principle as trading RSI divergences.