Disparity Index
This lesson will cover the following
- Explanation and calculation
- How to interpret this indicator
- Trading signals generated by the indicator
Developed by Steve Nison and introduced in his book ‘Beyond Candlesticks’, the Disparity Index measures the relative position of the most recent closing price of a trading instrument to a particular moving average and expresses this value as a percentage. It can be calculated as follows:
Disparity Index = (current market price – n-period moving average value) / n-period moving average value × 100.
If the index shows 0, the current price of the instrument equals the value of the n-period moving average.
If the index is below 0, the current price of the instrument is below the n-period moving average by that percentage.
If the index is above 0, the current price of the instrument is above the n-period moving average by that percentage.
The Disparity Index can generate several types of trading signals:
First, zero-line crossovers. When the indicator crosses above its zero line, a buy signal is generated, while a cross below the zero line generates a sell signal.
- Trade Forex
- Trade Crypto
- Trade Stocks
- Regulation: NFA
- Leverage: Day Margin
- Min Deposit: $100
Second, traders can look for divergences between price and the Disparity Index to identify potential trend reversal or continuation setups. There are two types of divergences – regular and hidden. Regular divergences signal trend reversals, while hidden divergences signal trend continuation.
A regular bullish divergence occurs when the market forms lower lows while the indicator forms higher lows.
A regular bearish divergence occurs when the market forms higher highs while the indicator forms lower highs.
A hidden bullish divergence occurs when the market forms higher lows while the indicator forms lower lows.
A hidden bearish divergence occurs when the market forms lower highs while the indicator forms higher highs.
Third, traders can take advantage of overbought and oversold conditions. The index is considered overbought when it is at or above its upper bound, and oversold when it is at or below its lower bound. These bounds should be determined carefully after assessing the sensitivity of the index to the instrument’s price movement.
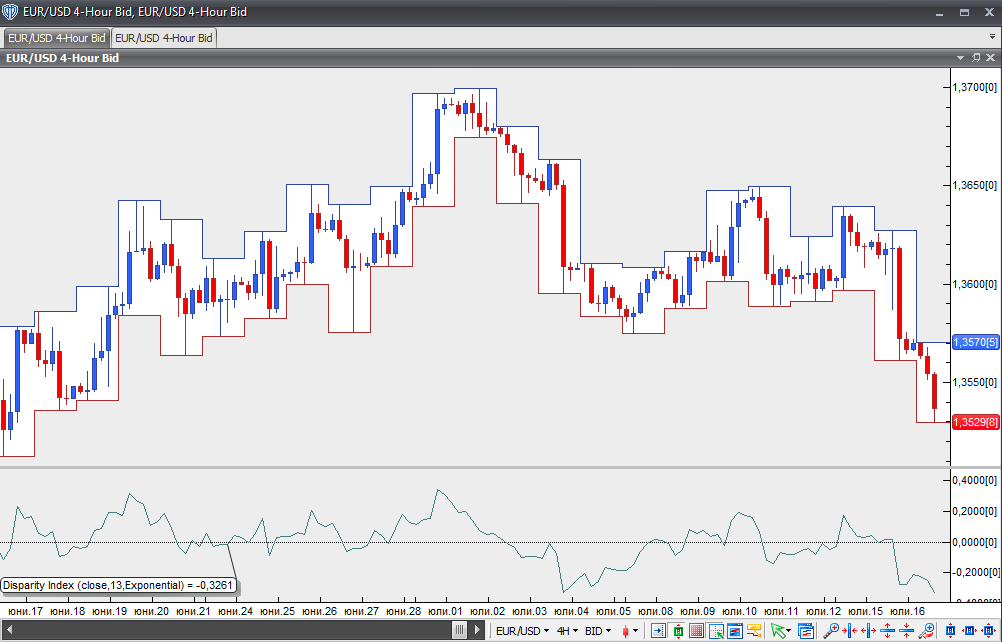
Chart Source: VT Trader