Balance of power
This lesson will cover the following
- Explanation and calculation
- How to interpret this indicator
- Trading signals generated by the indicator
This indicator was first introduced by Igor Livshin in the August 2001 edition of Technical Analysis of Stocks and Commodities magazine. The Balance of Power measures the strength of buyers against sellers in the market by assessing the ability of each side to drive prices to an extreme level. It is calculated as follows:
Balance of Power = (Close price – Open price) / (High price – Low price)
The resulting value is usually smoothed by a moving average.
The Balance of Power (BoP) can be used in three ways to provide trading signals:
First, to identify the direction of the trend. When the indicator is rising, it indicates that the market is in a bullish trend. When the indicator is falling, it suggests that the market is in a bearish trend. In addition, crossovers of the zero line provide trading signals. When the BoP crosses above zero, it is considered a signal to buy. When the BoP crosses below zero, it is considered a signal to sell.
Second, traders can search for divergences between price and the BoP to identify a potential trend reversal or continuation setup. There are two types of divergences – regular and hidden. Regular divergences signal trend reversals, while hidden divergences signal trend continuation.
- Trade Forex
- Trade Crypto
- Trade Stocks
- Regulation: NFA
- Leverage: Day Margin
- Min Deposit: $100
A regular bullish divergence occurs when the market forms lower lows while the BoP forms higher lows.
A regular bearish divergence occurs when the market forms higher highs while the BoP forms lower highs.
A hidden bullish divergence occurs when the market forms higher lows while the BoP forms lower lows.
A hidden bearish divergence occurs when the market forms lower highs while the BoP forms higher highs.
Third, traders can take advantage of overbought and oversold conditions. These extreme levels provide an early indication that a trend reversal is at hand. Overbought or oversold conditions are present when the BoP clusters its tops and bottoms. In this way, it sets overbought and oversold levels around those values. In some cases the price also tends to remain at these overbought or oversold levels and continue moving in the same direction for a certain period of time. Therefore, in such cases it is safer for the trader to wait for the BoP to cross the zero line before placing an order.
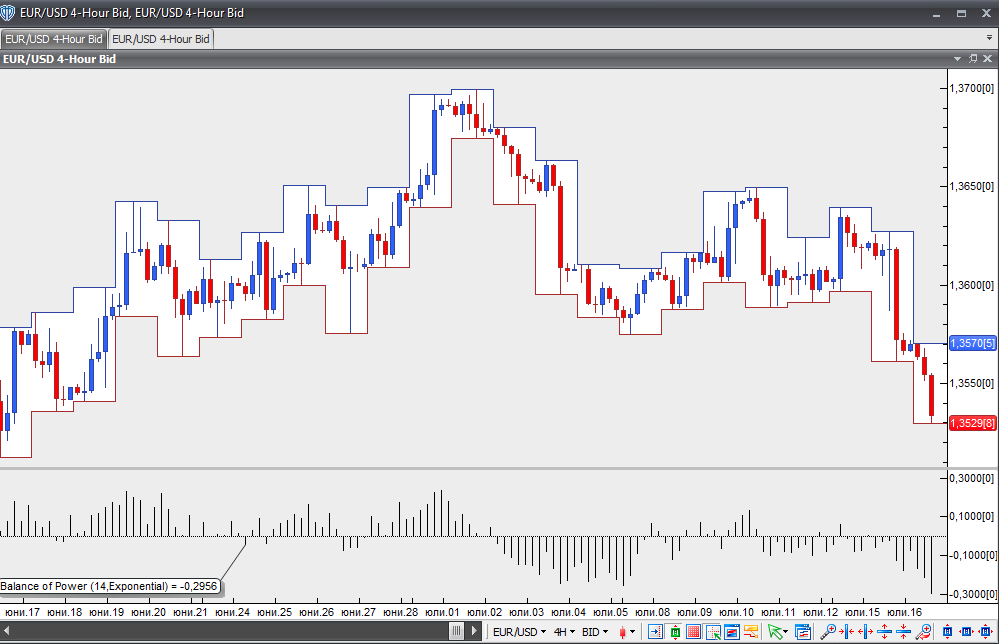
Chart source: VT Trader