Schaff Trend Cycle
This lesson will cover the following
- Explanation and calculation
- How to interpret this indicator
- Trading signals generated by the indicator
The Schaff Trend Cycle is a method developed by Doug Schaff in the 1990s, based on the concept that trends exhibit repeating high and low patterns, or cycles. It represents a modified MACD line that is processed through a modified stochastic algorithm and smoothed with Wilder’s smoothing to obtain the final Schaff Trend Cycle (STC) indicator. Its purpose is to identify the direction in which a trend cycle is moving and the possible peaks and bottoms within that cycle.
Three input values are used with the STC:
– Sh: short-term Exponential Moving Average with a default period of 23
– Lg: long-term Exponential Moving Average with a default period of 50
– Cycle: set at half the cycle length with a default value of 10.
The STC is calculated in the following order:
First, the 23-period and 50-period EMAs, along with the MACD value, are calculated:
EMA1 = EMA (Close, Short Length);
EMA2 = EMA (Close, Long Length);
MACD = EMA1 – EMA2.
Second, the 10-period stochastic of the MACD values is calculated:
%K (MACD) = %KV (MACD, 10);
%D (MACD) = %DV (MACD, 10);
Schaff = 100 x (MACD – %K (MACD)) / (%D (MACD) – %K (MACD)).
When the STC indicator is decreasing, it suggests that the trend cycle is falling, while the price tends to stabilise or follow the cycle to the downside.
When the STC indicator is increasing, it suggests that the trend cycle is rising, while the price tends to stabilise or follow the cycle to the upside.
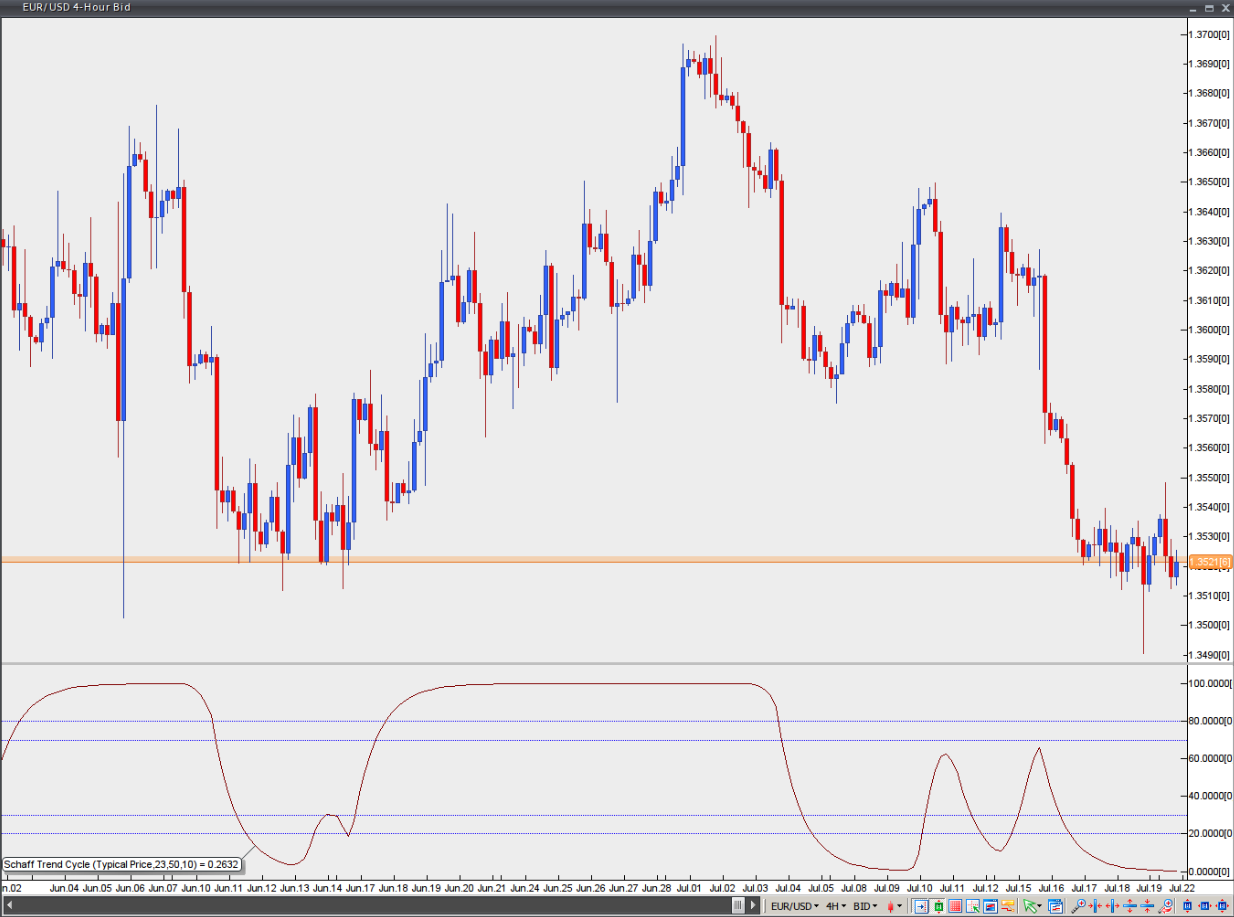
Chart source: VT Trader