Coppock curve
This lesson will cover the following
- Definition
- Calculation
- Interpretation
Developed by Edwin Coppock, the Coppock curve was first designed to identify long-term buying opportunities in the stock market, particularly in the S&P 500 and Dow Jones, and can also be used to generate entry signals in the forex market after its settings have been adjusted.
Coppock initially used a monthly time scale and calculated the indicator as a 10-month weighted moving average of the sum of the 14-month rate of change and the 11-month rate of change of the index. Buying opportunities arose when its value fell below zero, reversed, and crossed back into positive territory.
The basis of calculation for this indicator differs from that of most other oscillators, which begin by calculating the percentage change of the current price from a previous price, with the previous price serving as the reference point. The Coppock curve, however, reflects market participants’ emotional state as the sum of the prices’ percentage changes over a set number of past periods, which in turn provides insight into the market’s long-term momentum. For example, if the market is up 20% from a year earlier in June, in the previous month it was 15% higher compared with the same period last year, in April it was 14% higher year-on-year, and so on; we can therefore assume that the market has been dominated by bullish momentum during the look-back period.
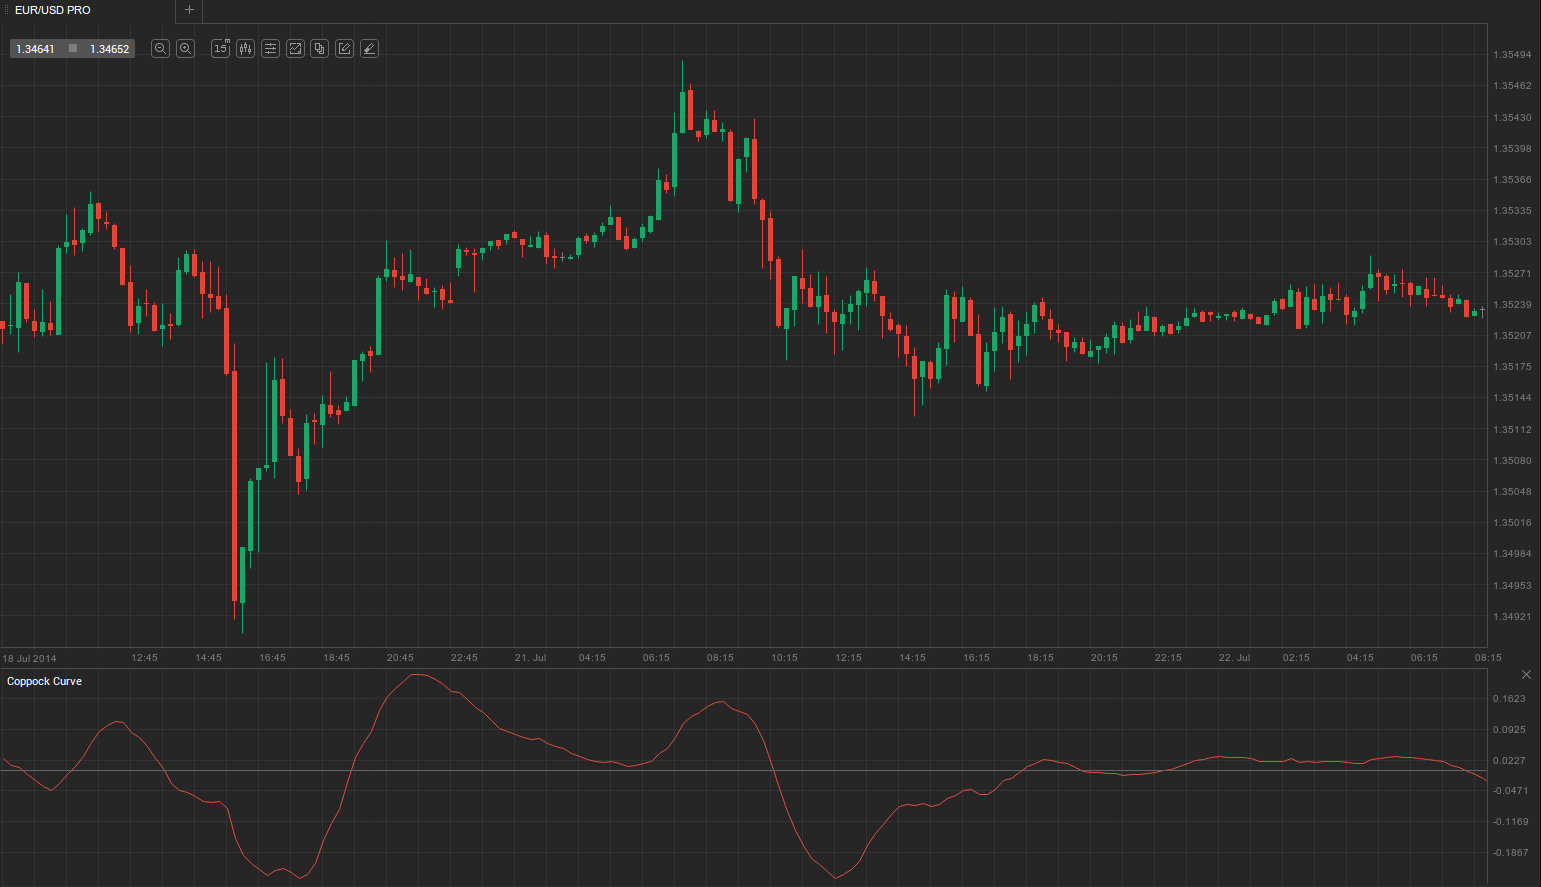
Being a trend-following indicator, the Coppock curve lags behind price action and therefore cannot pinpoint market bottoms exactly. However, its ability to highlight price reversals, and especially trend reversals, makes it a valuable tool in the arsenal of long-term traders. The example below shows how it is displayed on a trading platform.
- Trade Forex
- Trade Crypto
- Trade Stocks
- Regulation: NFA
- Leverage: Day Margin
- Min Deposit: $100
It is calculated using the following formula:
Coppock Curve = 10-period Weighted Moving Average of 14-period Rate of Change + 11-period Rate of Change
Basically, the rate of change (RoC) measures momentum, while the WMA smooths the data. After calculating the 14-period RoC and the 11-period RoC, they are smoothed by a 10-period WMA, which assigns greater weight to the most recent periods.
Coppock’s initial monthly look-back period would require a considerable amount of time to generate an entry signal. However, because of the indicator’s method of calculation, it is easily adjustable and flexible, and can therefore be used on any time frame, including intraday charts.
Apart from switching time frames, you can also adjust the look-back period. Shortening it will make the indicator more sensitive, but will also generate a larger number of false signals, and vice versa.
As mentioned earlier, it was originally used only to designate long entries signalled when the indicator crossed from negative into positive territory. However, many traders now also enter opposite trades and even trade divergences between the indicator and price.