Ichimoku Kinko Hyo
This lesson will cover the following
- Explanation and calculation
- How to interpret this indicator
- Trading signals generated by the indicator
This technical analysis method was developed in the late 1930s by Goichi Hosoda, a Japanese journalist known as Ichimoku Sanjin (‘what a man in the mountain sees’). The word Ichimoku can be translated as ‘a glance’, Kinko as ‘equilibrium’, and Hyo means ‘chart’ in Japanese. Thus, Ichimoku Kinko Hyo translates as ‘a glance at an equilibrium chart’. The chart aims to identify the probable direction of prices and to help traders choose the most appropriate entry and exit points.
An Ichimoku chart comprises five lines, calculated as follows:
– Tenkan-Sen (Conversion Line) = (Highest High + Lowest Low) / 2 over the past 9 periods
– Kijun-Sen (Base Line) = (Highest High + Lowest Low) / 2 over the past 26 periods
– Chikou Span (Lagging Span) = current trading day’s closing price, plotted 26 periods behind
– Senkou Span A (Leading Span A) = (Tenkan-Sen + Kijun-Sen) / 2, plotted 26 periods in the future
– Senkou Span B (Leading Span B) = (Highest High + Lowest Low) / 2 over the past 52 periods, plotted 26 periods in the future
Senkou Span A and Senkou Span B form an area known as the Kumo, or Cloud. It is used to identify the prevailing trend. There is a bull trend when the price is above the Cloud, a bear trend when the price is below the Cloud, and a trading range when the price is within the Cloud.
- Trade Forex
- Trade Crypto
- Trade Stocks
- Regulation: NFA
- Leverage: Day Margin
- Min Deposit: $100
A bull trend shows signs of strength when Leading Span A (green cloud line) is climbing and sits above Leading Span B (red cloud line). In this case, a green Cloud is formed.
A bear trend shows signs of strength when Leading Span A (green cloud line) is declining and lies below Leading Span B (red cloud line). In this case, a red Cloud is generated. Because the Cloud is projected 26 periods into the future, it allows traders to glimpse potential future support or resistance levels.
The following trading signals are generated:
Firstly, a buy signal is generated when the Conversion Line crosses the Base Line from below. A sell signal is generated when the Conversion Line crosses the Base Line from above.
Secondly, if a bullish crossover occurs above the Cloud, it is regarded as a very strong buy signal. If a bearish crossover occurs below the Cloud, it is regarded as a very strong sell signal.
Thirdly, if either type of crossover occurs within the Cloud, it produces a medium-strength buy or sell signal.
Fourthly, a bullish crossover below the Cloud is a weak buy signal, while a bearish crossover above the Cloud is a weak sell signal.
Fifthly, the Lagging Span can also be used to gauge the strength of the signal. If the Lagging Span is below the closing price of 26 periods ago and a sell signal is present, it indicates that the bears are strong; otherwise, the sell signal is weak. If the Lagging Span is above the closing price of 26 periods ago and a buy signal is present, it indicates that the bulls are strong; otherwise, the buy signal is weak.
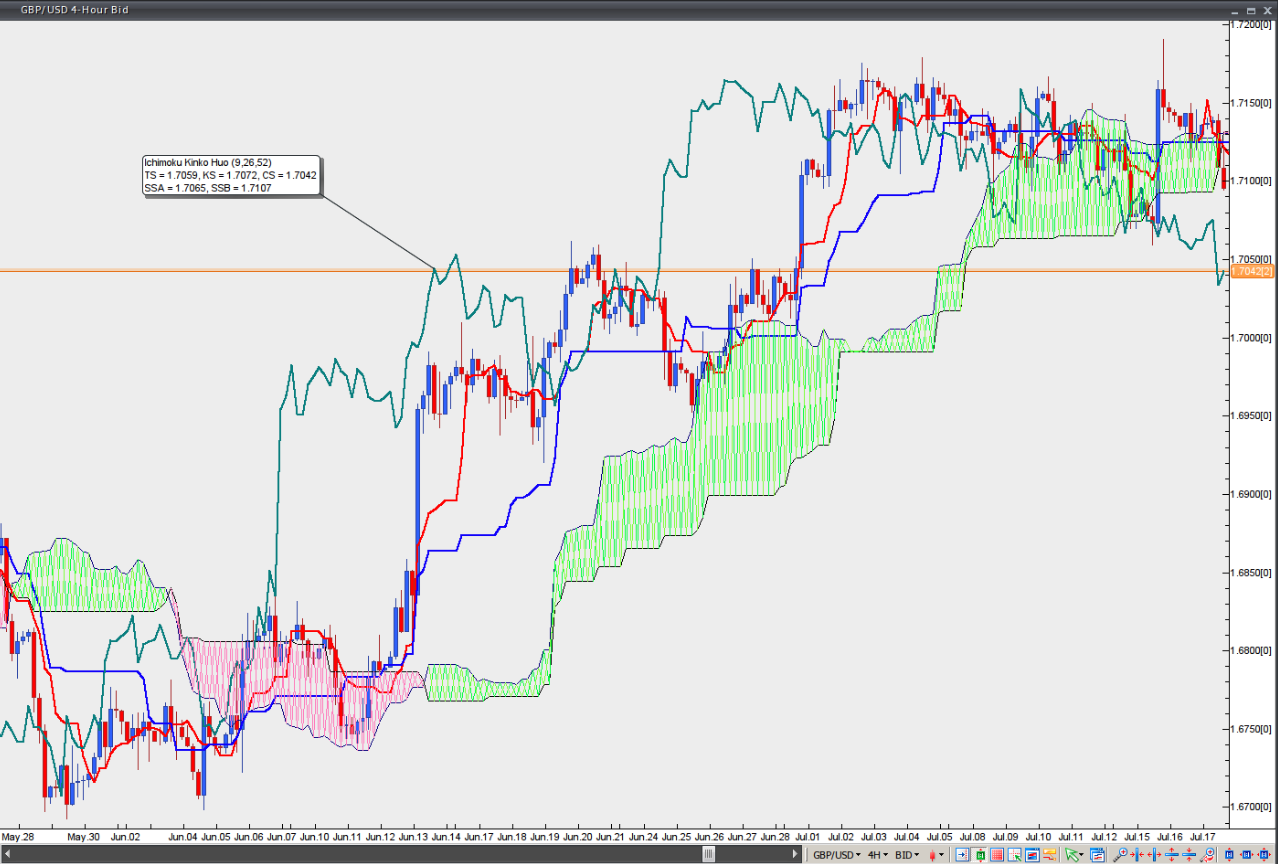
Chart Source: VT Trader