Keltner channels
This lesson will cover the following
- Definition
- Calculation
- Interpretation
Developed by Chester W. Keltner, the Keltner channels are a banded indicator, similar to Bollinger Bands and Moving Average Envelopes. It consists of an n-period simple moving average – the middle line – and two outer channel lines, which are derived by adding (for the upper one) and subtracting (for the lower one) an n-period simple moving average of the high/low range. In comparison, Bollinger Bands use standard deviation for band placement.
Since it was first introduced in 1960, the indicator has been modified and improved, most notably by Linda Raschke, who proposed the use of an exponential moving average as the middle line, and the Average True Range (ATR) to set the channel distance.
As a result, the EMA determines the channel’s direction, while the Average True Range determines its width. The two outer bands are usually set at a distance of twice the Average True Range from the middle line. Here is what the formula looks like:
Middle line = 20-period EMA
Upper boundary = 20-period EMA + (2 × ATR)
Lower boundary = 20-period EMA − (2 × ATR)
Because the indicator is centred on the moving average, and moving averages are lagging indicators, the channel itself will therefore lag behind the price. Although lagging indicators tend to have little predictive value, the Keltner channels can signify key points in market developments.
- Trade Forex
- Trade Crypto
- Trade Stocks
- Regulation: NFA
- Leverage: Day Margin
- Min Deposit: $100
Since channels are designed to contain the price action, any move that is strong enough to penetrate their boundaries and leave the channel warrants increased activity by traders. Depending on whether the market is in a strong bull or bear trend, or is trading sideways, a breakout through one of the boundaries (thus an overbought or oversold condition) can mean one of two things:
– if the market is clearly trending and the price breaks out of the Keltner channel in the direction of the prevailing trend, it reinforces the trend’s strength. The price will then often pull back towards the middle line, but the trend is expected to continue and a new breakout in the same direction is very likely.
– if the market is range-bound, the price tends to bounce between the upper and lower channel lines. If a price breakout through one of the boundaries occurs, it is often followed by a reversal back towards the middle line, or further down towards the opposite channel line. Check out the following screenshots. The first one visualises a trending market, while the second shows a trading range.
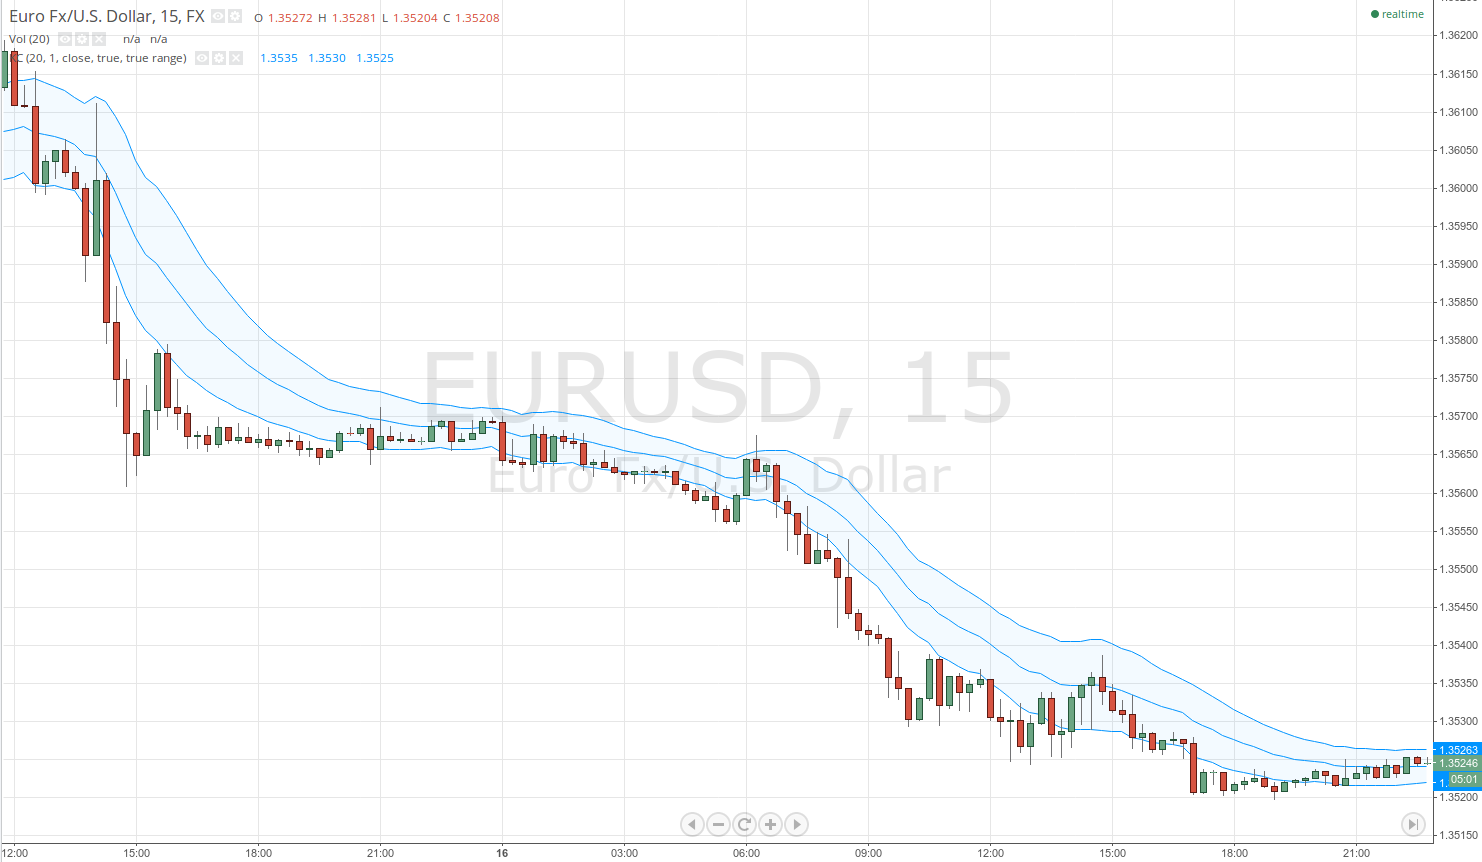
As you can see, the market is in a strong downtrend. The price action is constantly breaking through the lower Keltner band and retraces mostly to the median line before dropping to a lower low outside the channel.
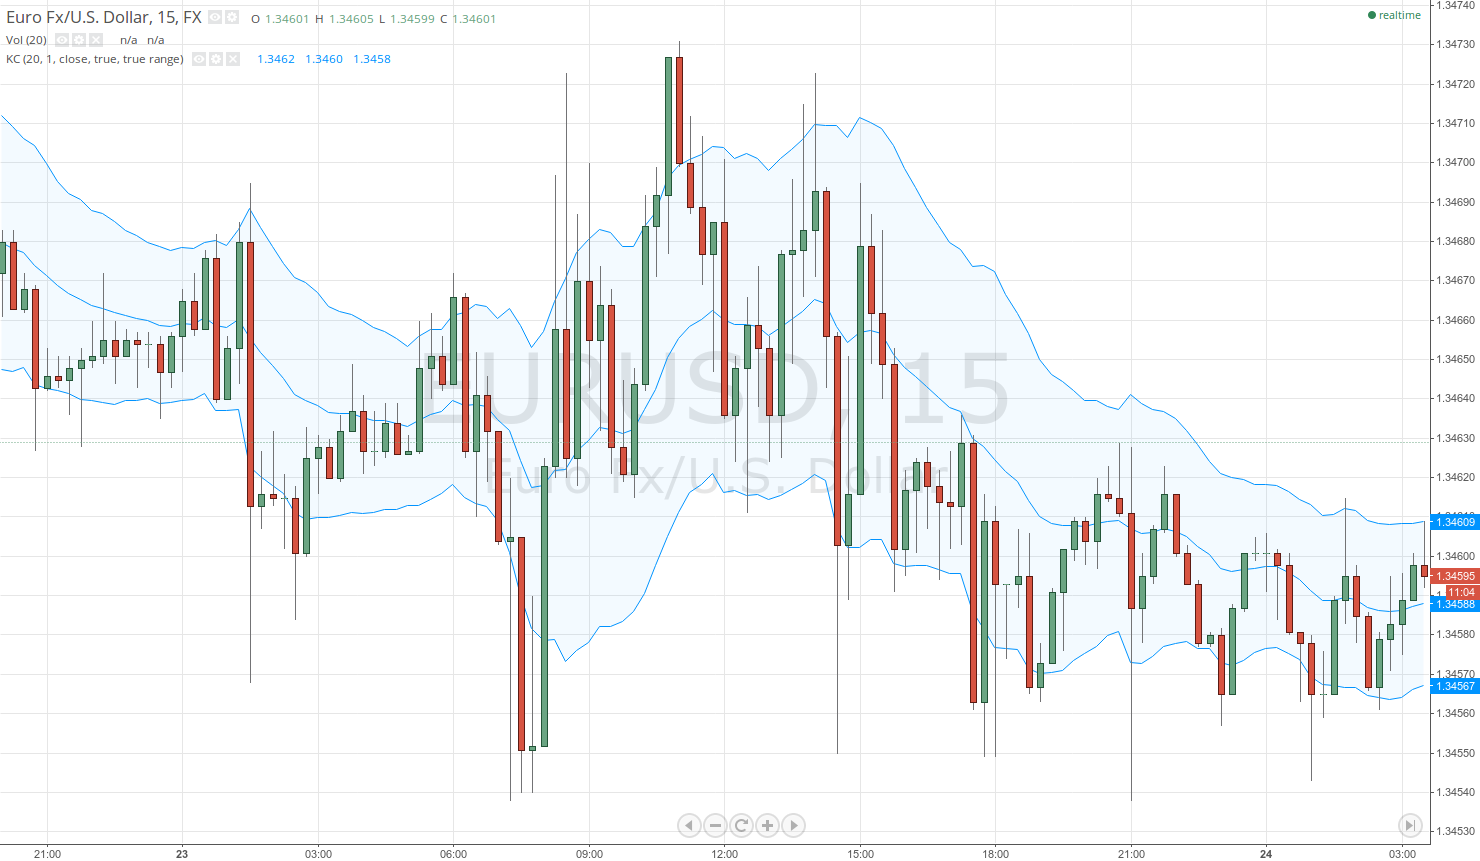
Here the market was trading sideways and the price was constantly fluctuating between the two Keltner bands. Moreover, most breaks beyond an outer channel line were followed not only by a retracement to the EMA but also by a push towards the opposite boundary.
Advantages
 There are a couple of distinct differences between Keltner channels and Bollinger Bands, which favour the use of the former. First, because Keltner channels are based on an exponential moving average, whereas Bollinger Bands use an SMA, the Keltner channels are more responsive to price fluctuations.
Second, because the Keltner channels’ outer boundaries are plotted at a distance measured via ATR, whereas Bollinger Bands are based on standard deviation, which is more volatile than ATR, the Keltner channels move more smoothly. Many consider this an advantage because the more constant width is better suited to trend identification and with-trend trading.