Linear regression and linear regression slope
This lesson will cover the following
- Explanation and calculation
- How to interpret this indicator
- Trading signals generated by the indicator
Linear regression indicator
 This indicator plots a string of linear regression lines drawn on successive days. The linear regression indicator has an advantage over a traditional moving average – it has less lag than the moving average and reacts more rapidly to price changes. It is a trend-identifying and trend-following indicator. The major trend is identified by calculating a linear regression trendline using the ‘least squares fit’ method, which helps to minimise the distance between the data points and the linear regression trendline.
The linear regression indicator is actually a projection of tomorrow’s price, plotted today. If prices are higher or lower than the forecast value, one may anticipate that they will eventually return to more realistic levels. The indicator highlights where the price should be trading on a statistical basis, while a deviation from the regression line is unlikely to last long.
Trading signals should be taken in the direction indicated by the linear regression indicator. A trader may also use another such indicator with a longer period as a filter. A long entry (or an exit from a short position) should be made when the indicator turns upwards. A short entry (or an exit from a long position) should be made when the indicator turns downwards.
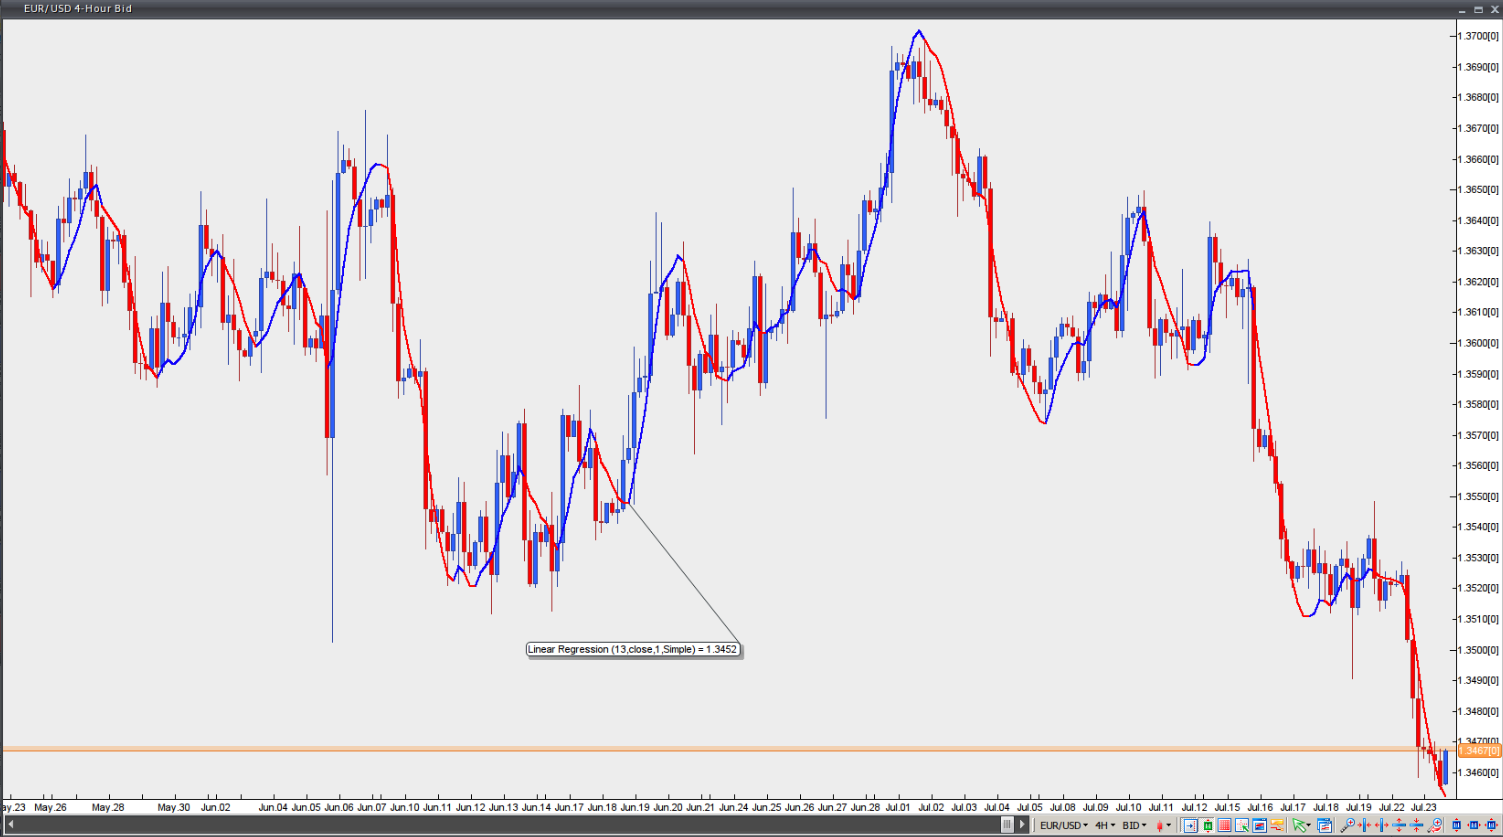
Chart source: VT Trader
Linear regression slope
 This indicator determines the slope value of theoretical regression lines, which include the current bar and the previous n-1 bars, for every bar loaded in the chart (where ‘n’ refers to regression periods). The slope value is normalised by multiplying the raw slope value by 100 and then dividing the result by the price.
Slope value = (Raw slope value x 100) / Price
Normalisation of slope values is crucial if one is to compare markets that trade within different ranges. The normalised slope value reflects the percentage price change per bar of the regression line. If the normalised slope is 0.25, this means that the regression line is increasing at a rate of 0.25% per bar. A normalised slope of -0.60 would suggest that the regression line is decreasing at a rate of 0.60% per bar.
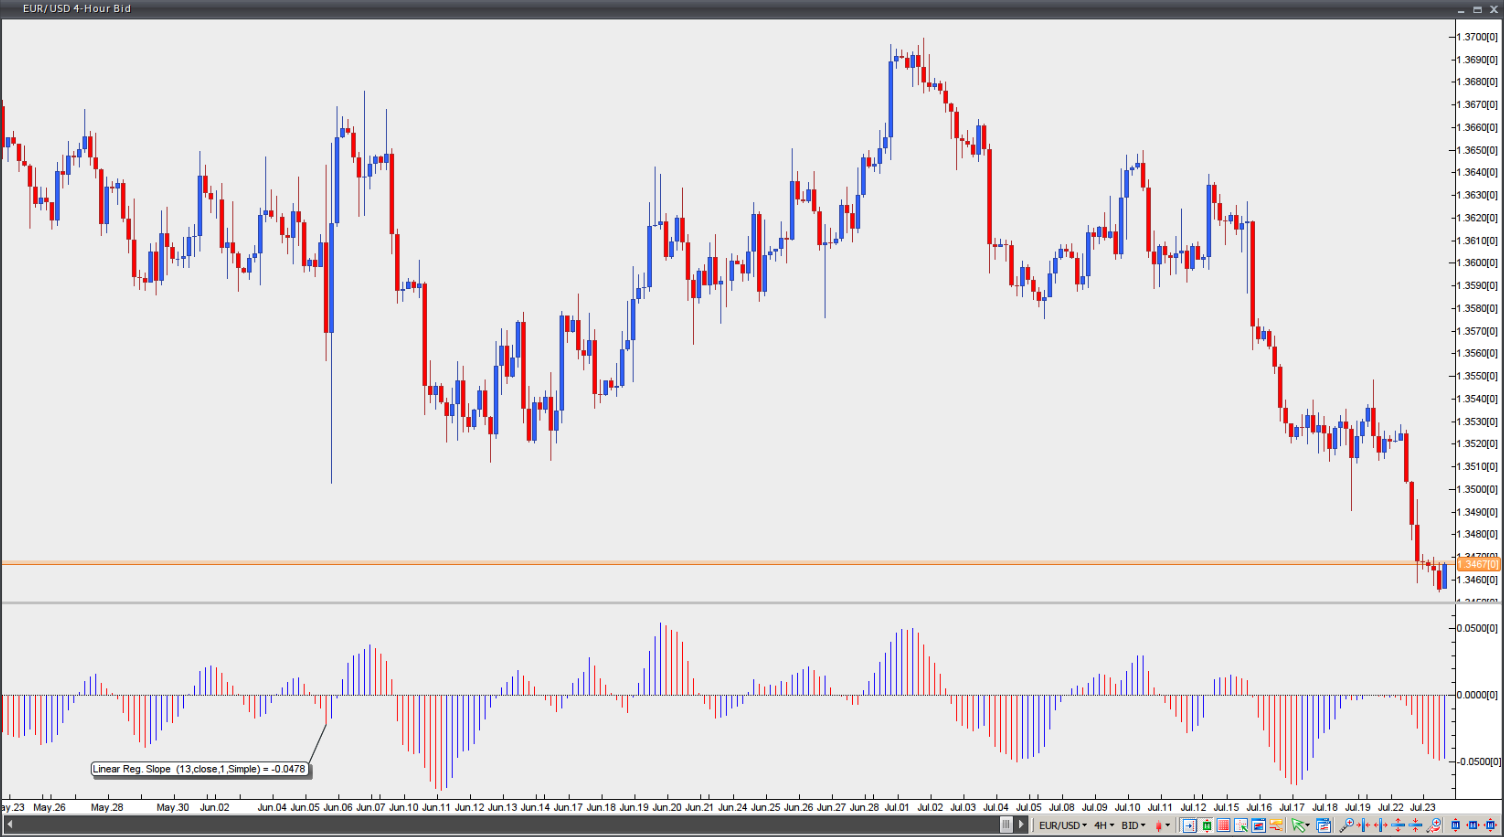
Chart source: VT Trader