DeMark’s projected range
This lesson will cover the following
- Definition
- Interpretation
Developed by Tom DeMark, DeMark’s Projected Range is a technical indicator used to project the high and low – and therefore the range – of the next bar, based on the most recent bar.
The calculation of the next bar’s values is based on the previous bar’s open and close prices, depending on whether the close is higher than, equal to, or lower than the open. Thus, if we are trading on a daily timeframe, DeMark’s Projected Range will attempt to predict the next day’s trading range based on price movement during the current day.
The indicator is visualised as a pair of dots, plotted above and below the period of interest. On some platforms the dots may be replaced by a line. The following screenshot shows this type of visualisation.
- Trade Forex
- Trade Crypto
- Trade Stocks
- Regulation: NFA
- Leverage: Day Margin
- Min Deposit: $100
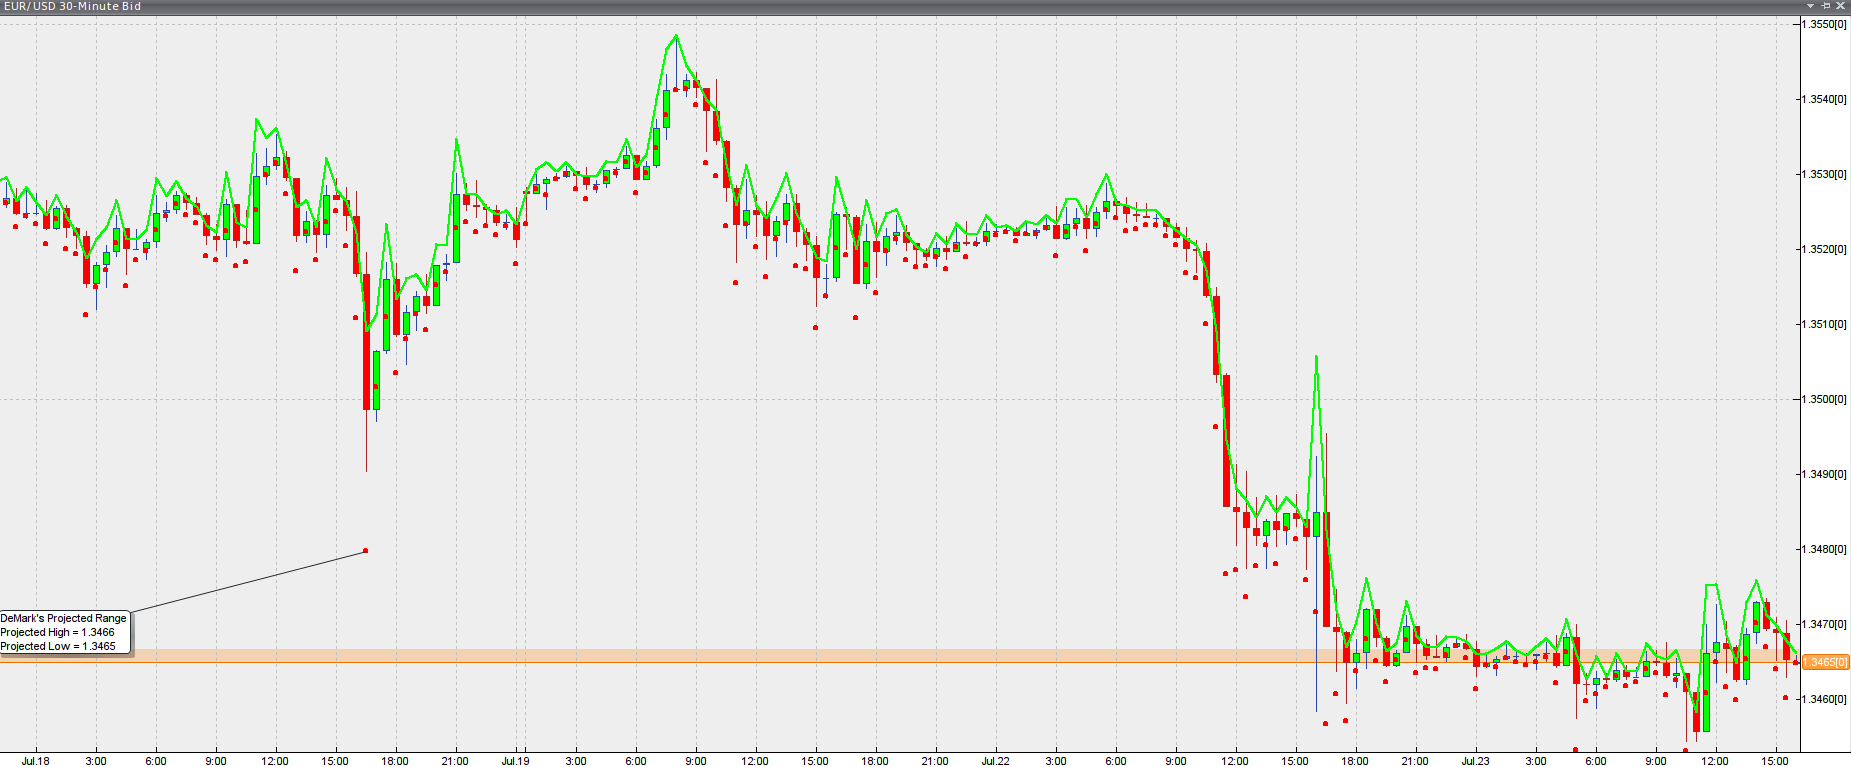
Chart source: VT Trader
The interpretation of the indicator’s values is quite straightforward: if the next bar opens within the projected range, the price is likely to remain within those boundaries throughout the period. If the price opens above the projected range’s high, the market is likely to continue in an uptrend. Conversely, if the candlestick opens below the projected range’s low, the price is expected to move downward.