Choppiness Index
This lesson will cover the following
- Definition
- Calculation
- Interpretation
Designed by E.W. Dreiss, the Choppiness Index helps traders determine whether the market is moving in a distinct direction or trading sideways. It is similar to the well-known Average Directional Movement Index; both are designed to gauge a trend’s strength and directional movement. However, some traders regard the Choppiness Index as the superior indicator.
The Choppiness Index is a non-directional indicator. It does not predict future market direction; rather, it reflects whether the market is choppy (trading sideways) or smooth (trending). In general, higher values indicate a choppy market, while lower values suggest directional movement.
Its formula involves the following calculation:
Choppiness Index = 100 * LOG10(SUM(ATR(1),n) / (MaxHi(n) – MinLo(n))) / LOG10(n), where:
– n is the user-defined period length
– ATR(1) is the Average True Range (period of 1)
– SUM(ATR(1), n) is the sum of the Average True Range over the past n periods
– MaxHi(n) is the highest high over the past n periods
– MinLo(n) is the lowest low over the past n periods
- Trade Forex
- Trade Crypto
- Trade Stocks
- Regulation: NFA
- Leverage: Day Margin
- Min Deposit: $100
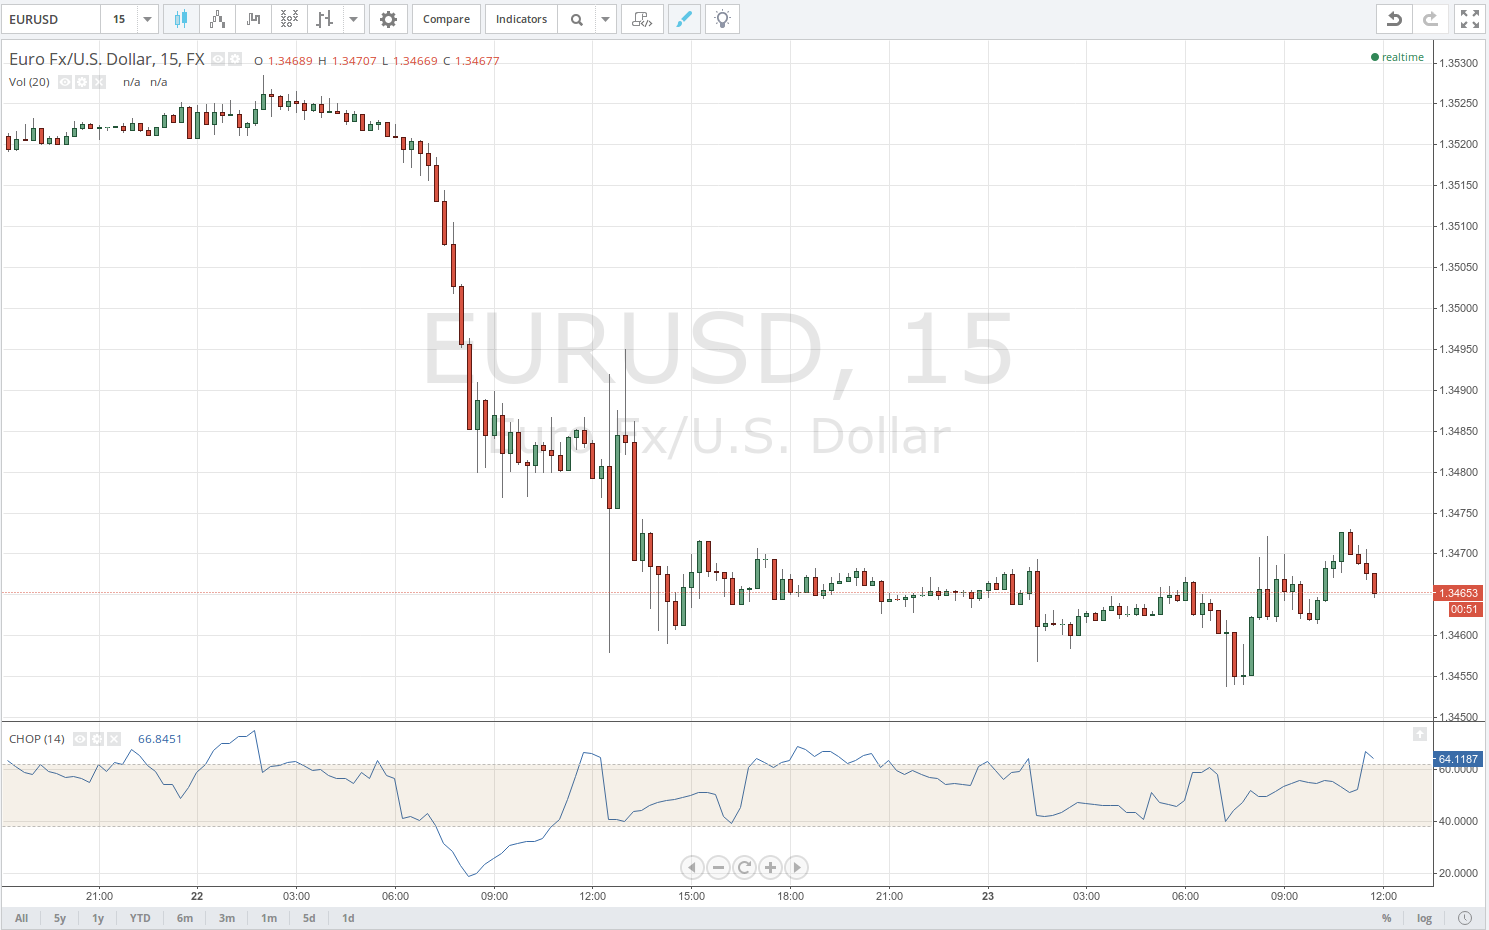
The results are displayed on a scale of 0 to 100. The closer the data is to 100, the choppier the market is, and vice versa. Default settings include Fibonacci-based upper and lower bands of 61.8 and 38.2 respectively, which indicate when a trend or trading range is becoming excessive.
The Choppiness Index does not reflect the market’s directional movement; instead, it shows whether a trend is strong (the closer the index’s value is to zero, the stronger the trend). Conversely, the more heavily the market is consolidating, the closer the index will be to 100. The screenshot below illustrates the indicator in trading software.
A few conclusions can be drawn from the thresholds mentioned above. Values above 61.8 are observed during tight trading ranges; therefore, when the index rises above the upper band it suggests that the market may be poised for a strong breakout in the near future after a period of tight consolidation.
Conversely, because values below 38.2 occur during strong trends in either direction, a fall below the lower band is often a sign that market momentum may soon begin to wane as the trend enters its exhaustion phase.
However, just as with overbought and oversold levels in indicators such as the Relative Strength Index, you shouldn’t base your decisions solely on the Choppiness Index rising above 61.8 or dropping below 38.2; rather, use it in conjunction with other indicators as a confirmation tool (for example, the Parabolic SAR).