Kaufman’s efficiency ratio
This lesson will cover the following
- Explanation and calculation
- How to interpret this indicator
- Trading signals generated by the indicator
Developed by Perry Kaufman and introduced in his book ‘New Trading Systems and Methods’, the Efficiency Ratio reflects the relationship between market speed and volatility. In some cases it is used as a filter that helps a trader avoid ‘choppy’ markets or trading ranges and identify smoother trends.
It is calculated by dividing the net change in price over n periods by the sum of all bar-to-bar price changes during the same n periods.
If the market is trending smoothly, the ratio will be higher. If the ratio is close to zero, this implies that market movement is inefficient and ‘choppy’.
A reading of +100 indicates that the trading instrument is in a bullish trend and moving with perfect efficiency.
A reading of -100 indicates that the trading instrument is in a bearish trend and moving with perfect efficiency.
It is practically impossible for any instrument to achieve a perfect Efficiency Ratio, as any movement against the major trend during the examined period will cause the ratio to fall.
- Trade Forex
- Trade Crypto
- Trade Stocks
- Regulation: NFA
- Leverage: Day Margin
- Min Deposit: $100
If the Efficiency Ratio shows a reading above +30, this is indicative of a smoother bullish trend. If the ratio shows a reading below -30, this is indicative of a smoother bearish trend.
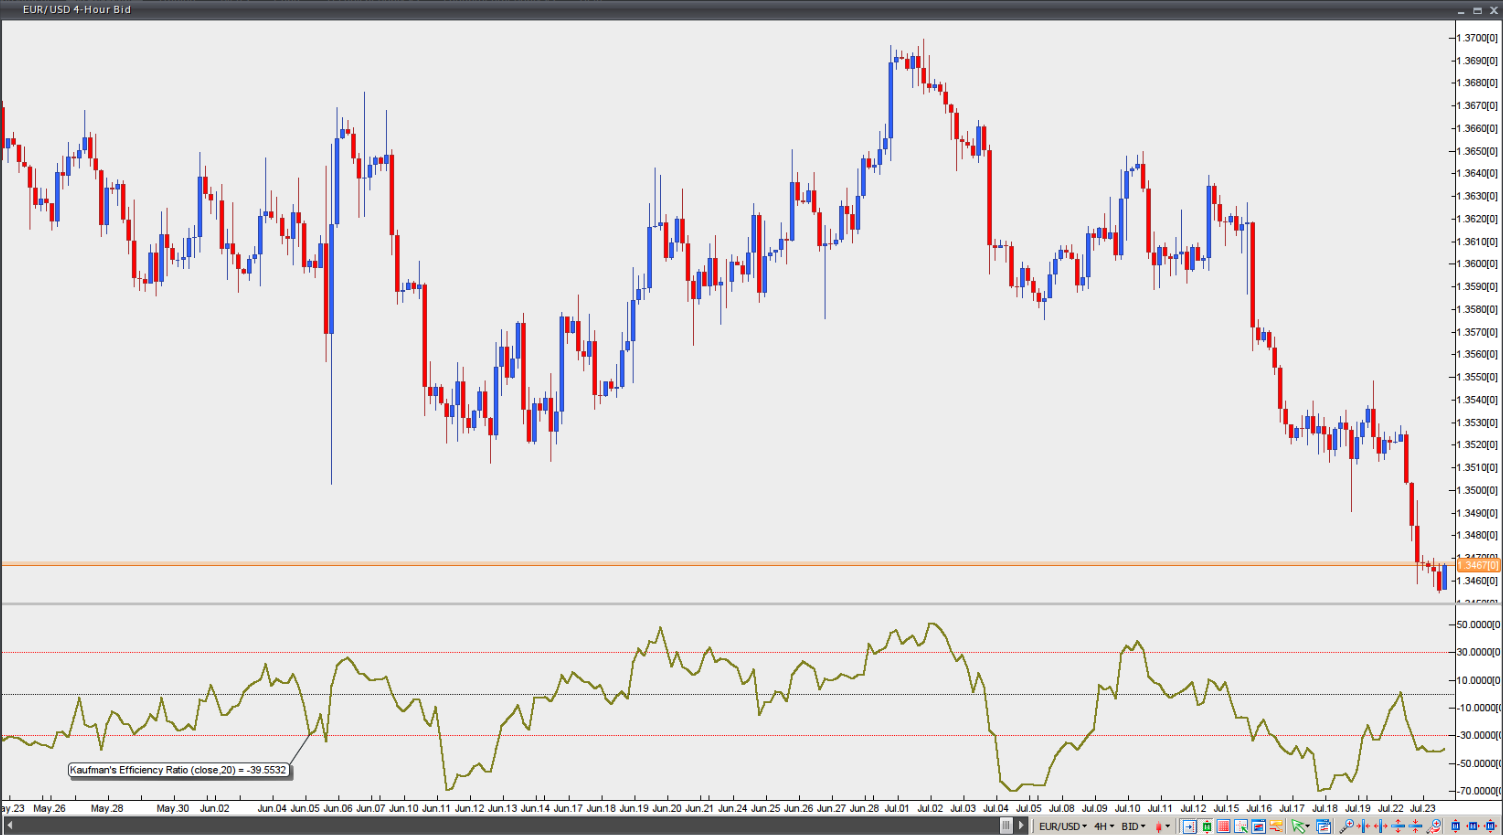
Chart Source: VT Trader