DeMark’s DeMarker I
This lesson will cover the following
- Explanation and calculation
- How to interpret this indicator
- Trading signals generated by the indicator
Developed by Thomas DeMark, the DeMarker I indicator attempts to measure demand for a trading instrument by comparing the high and low prices of the current bar with those of the prior bar. In this way, it helps identify potential price peaks and bottoms. The DeMarker I is meant to overcome the common shortcomings of traditional indicators that identify overbought and oversold conditions.
The DeMarker I comprises two indicators – DeMax and DeMin. DeMax compares the high price of the current bar with the high price of the prior bar. DeMin compares the low price of the current bar with the low price of the prior bar.
The DeMarker indicator fluctuates between -100 and +100 and can generate various signals:
First, it is used to identify overbought and oversold conditions. In this case, it functions in a similar way to the Relative Strength Index (RSI) and uses the same extreme levels (30 for oversold and 70 for overbought).
Second, traders look for bullish or bearish divergences between the DeMarker and the price of the trading instrument, as with traditional overbought/oversold indicators.
- Trade Forex
- Trade Crypto
- Trade Stocks
- Regulation: NFA
- Leverage: Day Margin
- Min Deposit: $100
Third, trendlines can be drawn between peaks and bottoms formed by the DeMarker. Trading signals are generated when the indicator breaches above or below these trendlines.
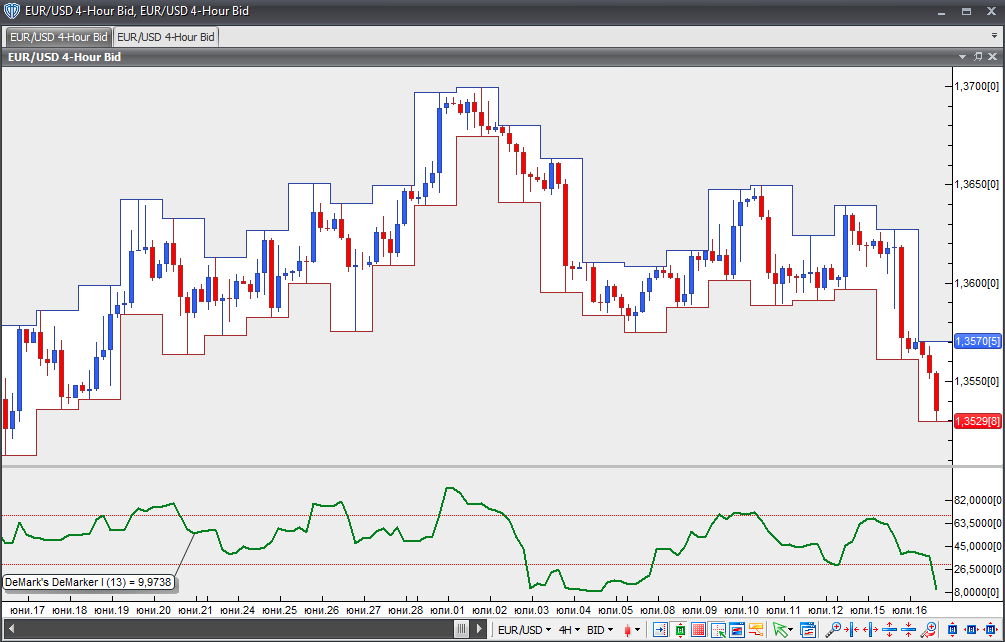
Chart Source: VT Trader