Aroon oscillator
This lesson will cover the following
- Explanation and calculation
- How to interpret this indicator
- Trading signals generated by the indicator
The Aroon Oscillator represents the difference between the Aroon (Up) and Aroon (Down) indicators. It oscillates between -100 and +100, with zero as the centreline. The oscillator reads +100 when Aroon (Up) is 100 and Aroon (Down) is 0. It reads -100 when Aroon (Up) is 0 and Aroon (Down) is 100.
A sustained price move to the upside will push the Aroon Oscillator towards +100, whereas a strong move to the downside will push it towards -100. A relatively high positive reading occurs because Aroon (Up) is high, while a relatively low negative reading occurs because Aroon (Down) is high.
When the oscillator is above zero, Aroon (Up) is greater than Aroon (Down); in other words, the market has been recording new highs more recently than new lows. Conversely, a reading below zero indicates that Aroon (Down) is greater than Aroon (Up), meaning the market has been making new lows more recently than new highs.
- Trade Forex
- Trade Crypto
- Trade Stocks
- Regulation: NFA
- Leverage: Day Margin
- Min Deposit: $100
The Aroon Oscillator can be used to determine the general trend bias. It tends to remain above zero during a strong bullish trend and below zero during a strong bearish trend.
Some technical analysts adjust the extreme parameters to filter signals more effectively. Widening the two extremes produces signals with greater lag and a longer time horizon. The bullish extreme can be set at +85, while the bearish extreme can be set at -85. A reading of +85 indicates that Aroon (Up) is between 85 and 100, while Aroon (Down) is between 0 and 15. The opposite applies to a reading of -85. A move above +85 can be considered strong enough to signal the beginning of an extended rally until it is invalidated by a move below -85. The latter can absorb the majority of pullbacks that occur during the bullish trend. A move below -85 can be considered strong enough to signal the beginning of an extended decline. This signal will not be reversed until a move above +85, a level high enough to absorb most bounces from oversold conditions.
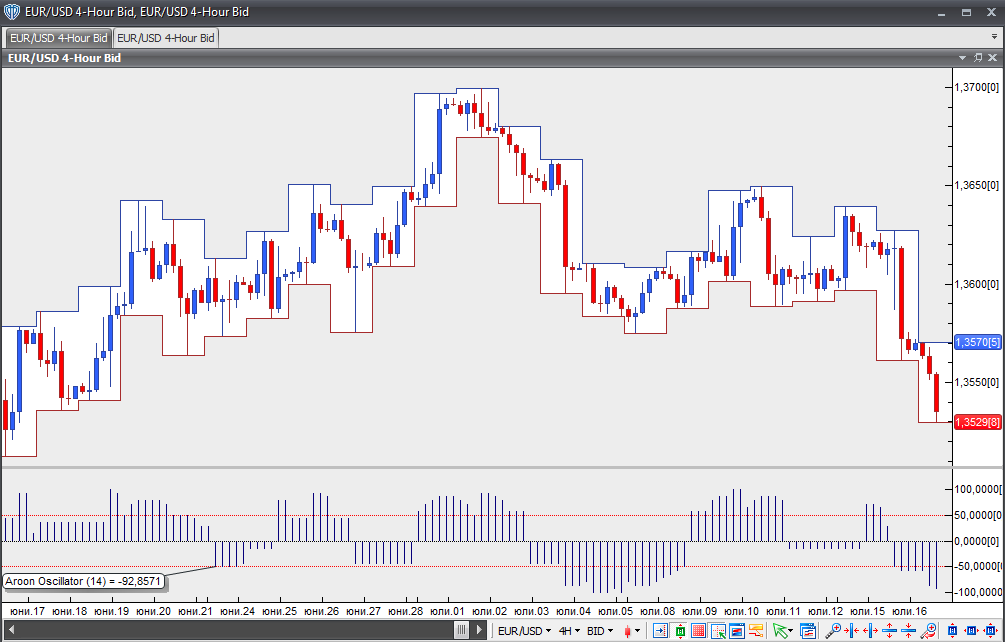
Chart Source: VT Trader