Bollinger %B
This lesson will cover the following
- Explanation and calculation
- How to interpret this indicator
- Trading signals generated by the indicator
Bollinger %B is derived from John Bollinger’s original Bollinger Bands indicator. %B defines the price of a trading instrument relative to the upper and lower Bollinger Bands. Six relationship levels can be outlined:
– if the closing price is at the upper Bollinger Band, %B equals 1
– if the closing price is at the lower Bollinger Band, %B equals 0
– if the closing price is above the upper Bollinger Band, %B is above 1
– if the closing price is below the lower Bollinger Band, %B is below 0
– if the closing price is above the middle Bollinger Band (20-day SMA), %B is above 0.50
– if the closing price is below the middle Bollinger Band (20-day SMA), %B is below 0.50
Bollinger %B is calculated as follows:
%B = ((Closing price – Lower Bollinger Band) / (Upper Bollinger Band – Lower Bollinger Band)) x 100
The default setting for %B is based on the default parameters for Bollinger Bands (20,2).
%B is used to identify overbought and oversold conditions. As with the majority of momentum oscillators, a trader should look for short-term oversold conditions when the intermediate-term trend is bullish, and for short-term overbought conditions when the intermediate-term trend is bearish.
- Trade Forex
- Trade Crypto
- Trade Stocks
- Regulation: NFA
- Leverage: Day Margin
- Min Deposit: $100
When %B moves above 1, it is considered an overbought condition. When %B moves below 0, it is considered an oversold condition. However, overbought and oversold readings may not always produce reliable buy and sell signals. A shallow pullback may occur, after which the primary trend can resume. John Bollinger describes a situation when prices ‘walk the band’ during strong trends. In a strong bull trend, prices can walk up the upper band and, in rare cases, touch the lower band. In a strong bear trend, prices can walk down the lower band and, in rare cases, touch the upper band.
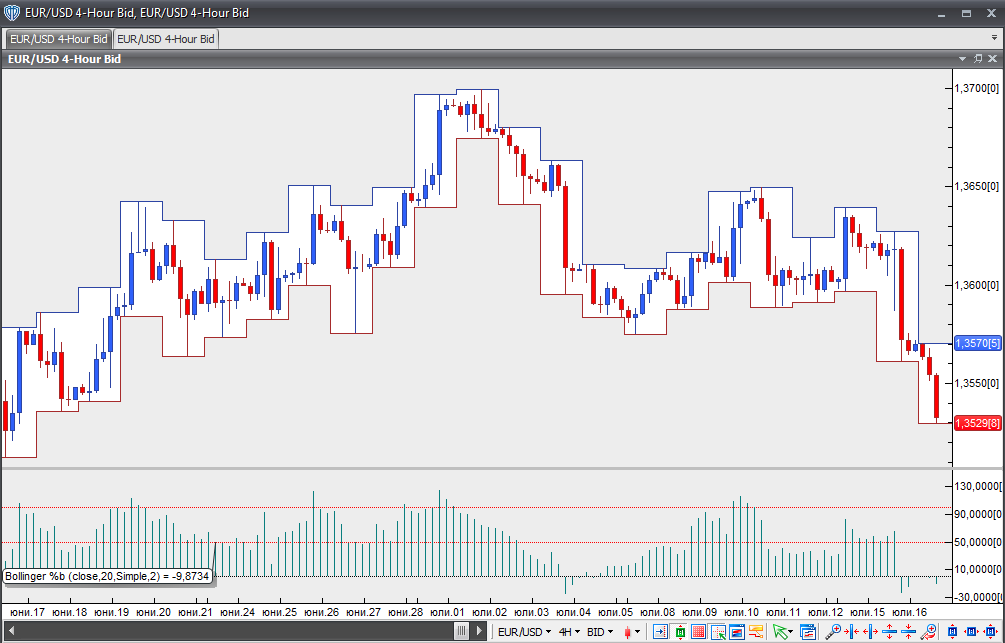
Chart Source: VT Trader