Momentum
This lesson will cover the following
- Explanation and calculation
- How to interpret this indicator
- Trading signals generated by the indicator
The concept behind this technical indicator is quite simple. Momentum reflects the velocity of price changes and is calculated as the difference between the current bar’s price and the price a selected number of bars ago. It shows the rate at which the price of the trading instrument changes over the specified period. The faster the price surges, the more momentum will increase. The faster the price falls, the more momentum will decline. If prices begin changing at a slower rate, momentum will also slow down and return to a more normal level.
Momentum can generate several types of trading signals:
First, crossing the zero line. If the Momentum indicator crosses above its zero line, this is considered a signal to buy.
If the Momentum indicator crosses below its zero line, this is considered a signal to sell.
Second, looking for breaches of trend lines. By connecting the tops and bottoms of the Momentum indicator, a trader can draw trend lines. Momentum typically starts to shift before the price does; thus, it can be considered a leading indicator.
If the indicator breaks above a bearish trend line, a bullish reversal is likely to occur.
If the indicator breaks below a bullish trend line, a bearish reversal is likely to occur.
Third, taking advantage of overbought and oversold conditions. A trader must identify potential overbought and oversold levels based on historic values of the indicator. After the two extreme levels have been identified, at least two-thirds of previous Momentum readings should occur between these extremes.
A buy signal is generated when the indicator falls below the oversold level and then moves back above it. A sell signal is generated when the indicator rises above the overbought level and then moves back below it.
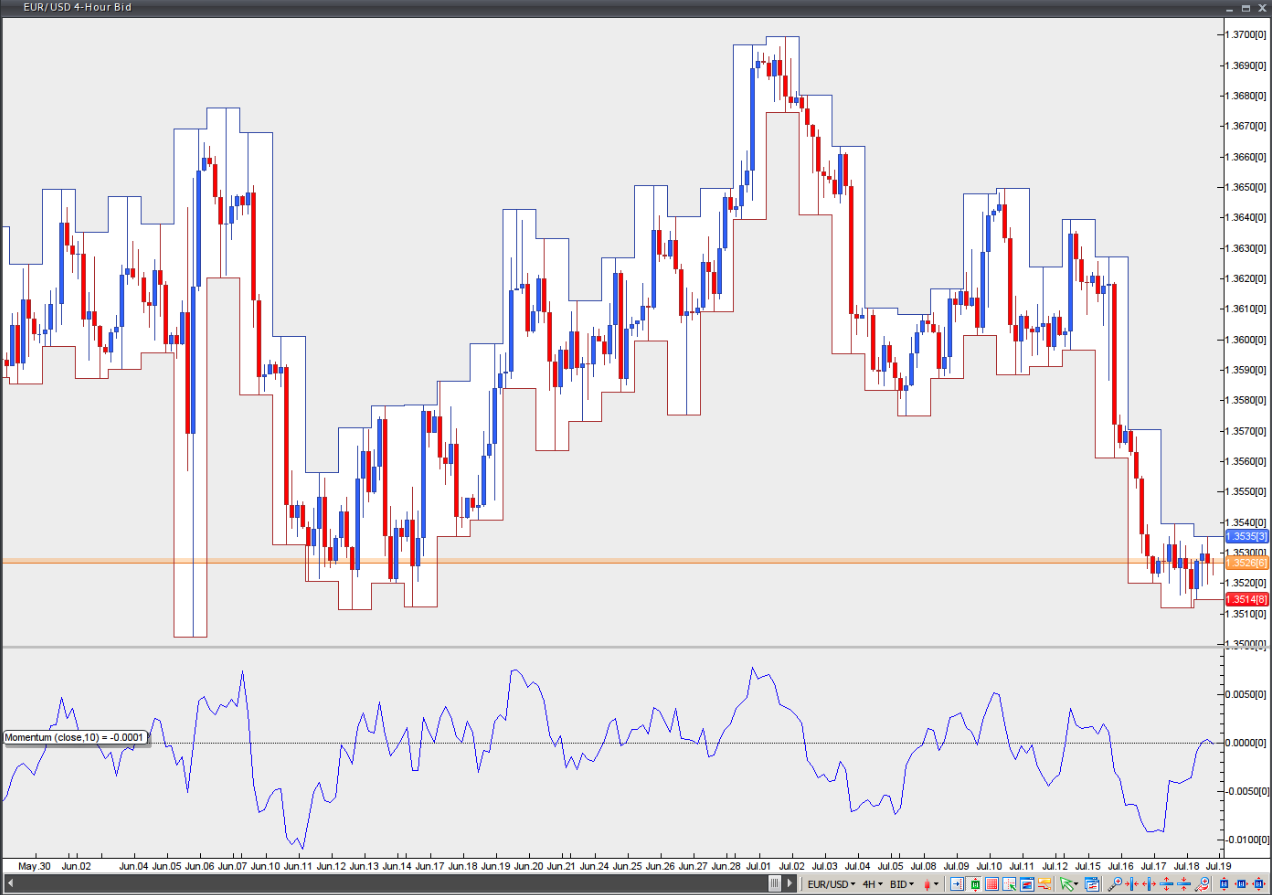
Chart Source: VT Trader