Linear regression acceleration
This lesson will cover the following
- Explanation and calculation
- How to interpret this indicator
- Trading signals generated by the indicator
This indicator reflects the change in the normalised slope of the regression line on the current bar compared with the normalised slope on the previous bar. The resulting normalised acceleration value is applied to every bar loaded in the chart.
If the normalised acceleration value is 0.25, the regression line’s normalised slope is increasing at a rate of 0.25 per bar. If the normalised acceleration value is -0.60, the regression line’s normalised slope is decreasing at a rate of -0.60 per bar.
A positive acceleration value does not necessarily mean the slope is positive – it only indicates that the slope is rising. Likewise, a negative acceleration value does not necessarily mean the slope is negative – it simply indicates that the slope is falling.
If the normalised slope value of the current bar is 0.50 and that of the previous bar is 0.41, the normalised acceleration of the current bar can be calculated as (0.50 – 0.41 = 0.09).
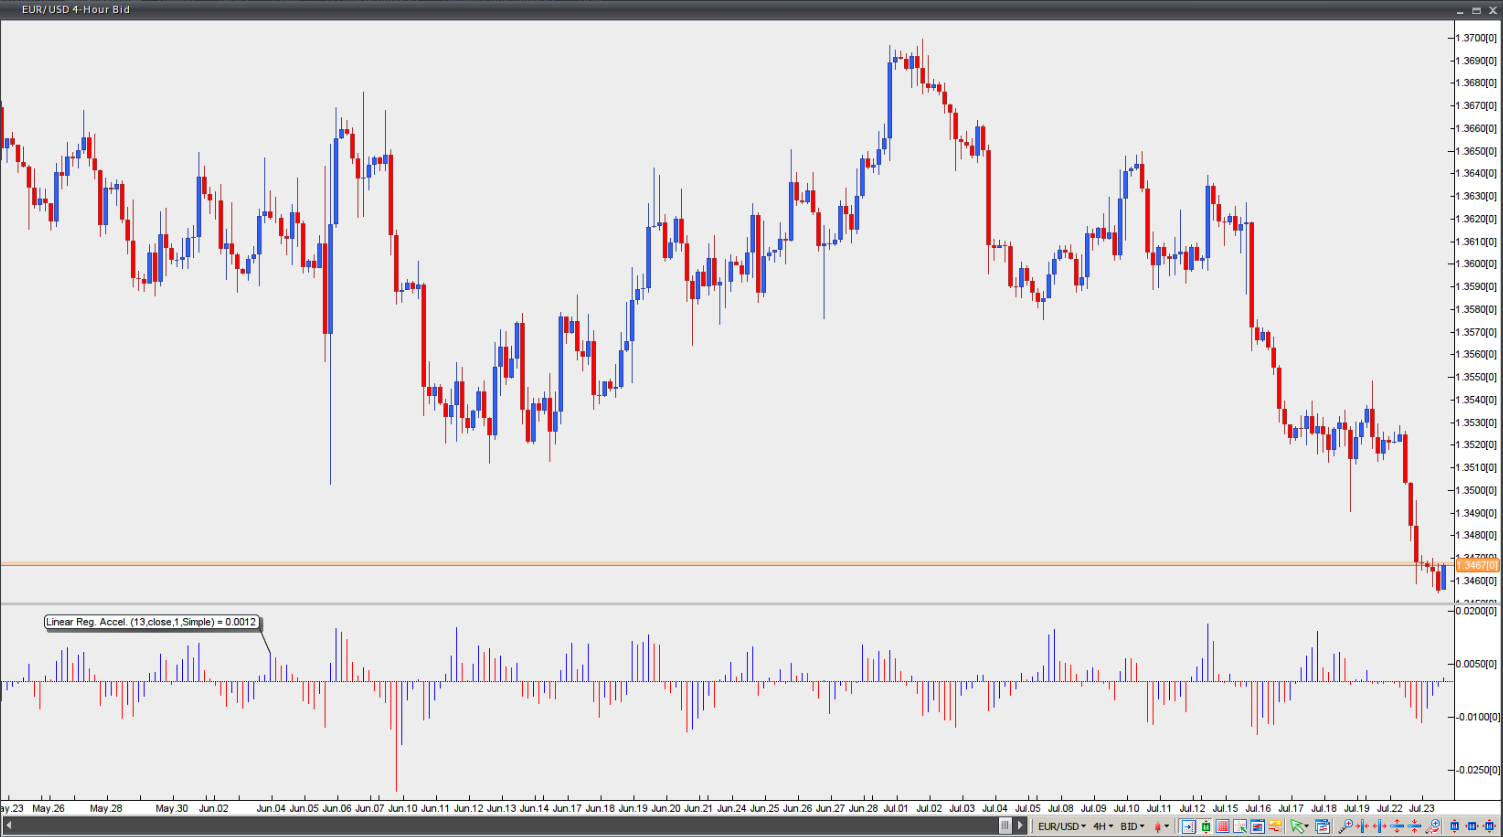
Chart source: VT Trader