Relative momentum index
This lesson will cover the following
- Explanation and calculation
- How to interpret this indicator
- Trading signals generated by the indicator
Developed by Roger Altman and originally described in the February 1993 issue of Technical Analysis of Stocks & Commodities magazine, the Relative Momentum Index (RMI) is essentially a variation of the Relative Strength Index (RSI). The RMI counts up and down days from today’s close relative to the close ‘n days’ ago (n is not limited to 1, as required by the RSI). The RSI, on the other hand, counts days up and down from close to close.
If we have the RMI parameterised as follows – closing price, RMI period of 14, momentum period of 1 – it will be equal to an RSI with a period of 14 and closing price. This is because the momentum parameter estimates only a one-day price change.
Increasing the momentum period will result in smoother RMI fluctuations.
The RMI is an oscillator and, as such, it has the same advantages and disadvantages as other technical methods, reflecting overbought and oversold conditions. In a trending environment, the RMI will usually remain at, or close to, overbought or oversold levels for quite a while. In trading ranges, however, the RMI tends to be more predictable, oscillating between an oversold level (10-30) and an overbought level (70-90).
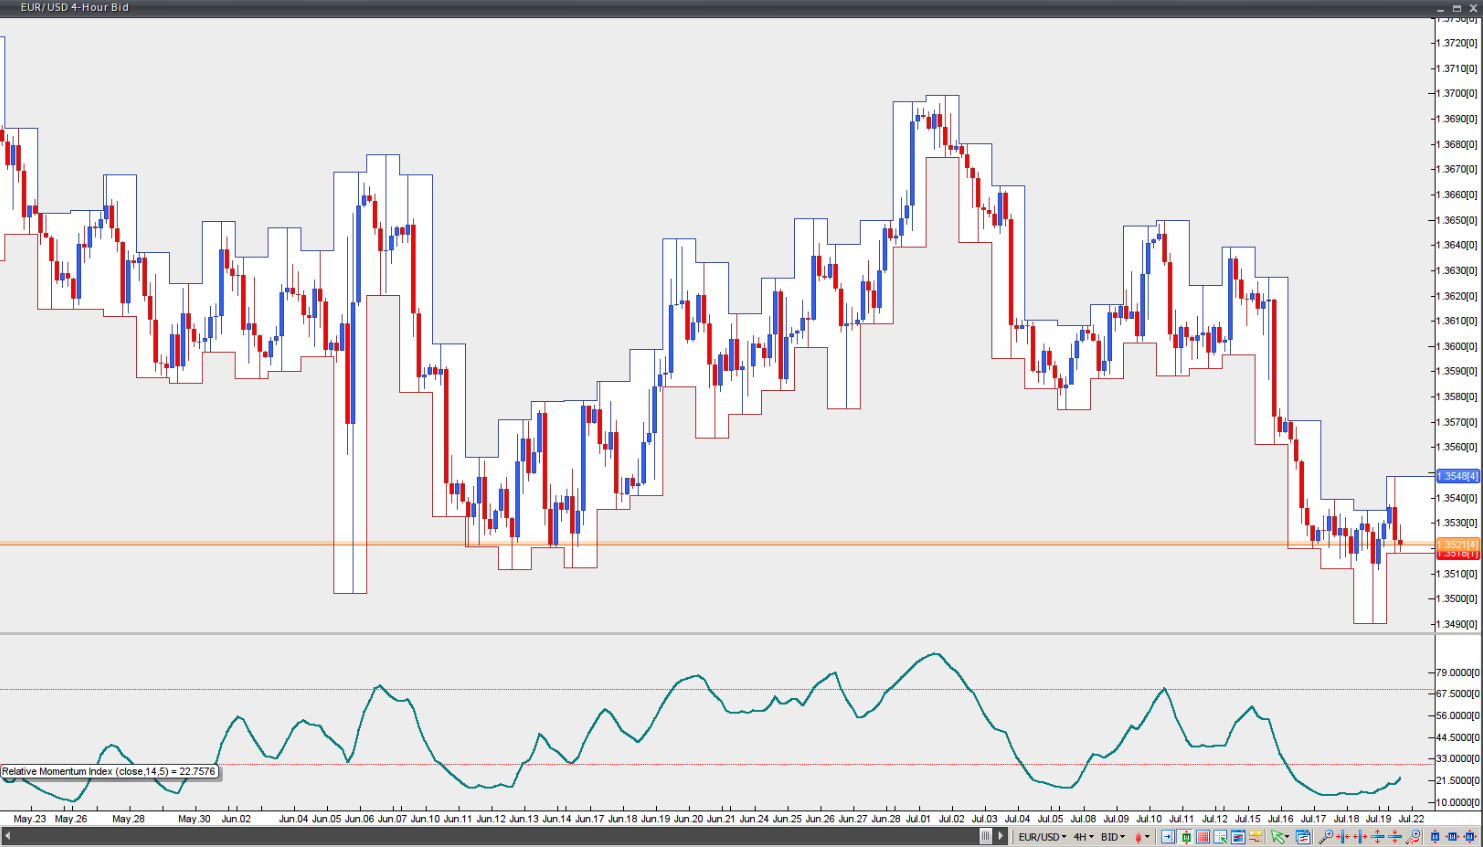
Chart Source: VT Trader