Chande’s Range Action Verification Index
This lesson will cover the following
- Explanation and calculation
- How to interpret this indicator
- Trading signals generated by the indicator
Developed by Tushar Chande, the Range Action Verification Index (RAVI) is used to help identify whether the market is in a trend. The indicator displays the percentage difference between current and past prices. Chande recommends two key levels for the RAVI – 3% or 1%, depending on the market.
A bullish trend begins when the RAVI crosses the 3% key line from the bottom up. The bullish trend is considered active as long as the indicator line is rising.
A bearish trend begins when the RAVI crosses the 1% key line from the top down. The bearish trend is considered active as long as the indicator line is falling.
- Trade Forex
- Trade Crypto
- Trade Stocks
- Regulation: NFA
- Leverage: Day Margin
- Min Deposit: $100
If the RAVI line returns to zero, it indicates that the trend has ended and the market is now in a trading range.
If the RAVI line turns back again but does not enter the area between the two key levels, it indicates that the trend has resumed.
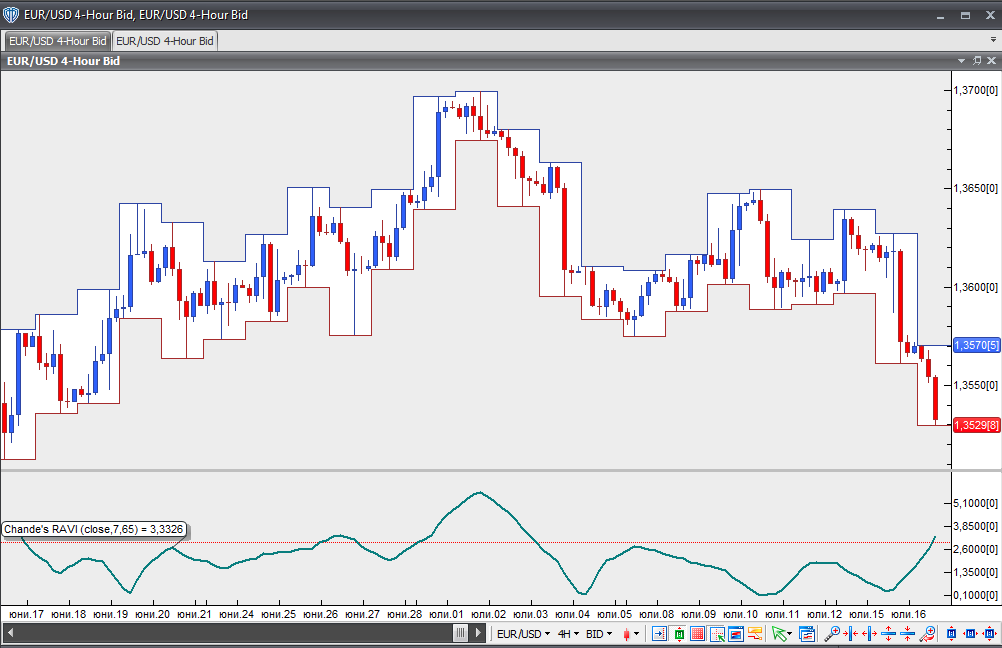
Chart Source: VT Trader