McClellan oscillator and McClellan histogram
This lesson will cover the following
- Definition
- Calculation
- Interpretation
Developed by Sherman and Marian McClellan, the McClellan oscillator is a momentum indicator that measures market breadth based on the smoothed difference between the number of advancing and declining periods. It is similar to the widely used Moving Average Convergence Divergence indicator (MACD) and is generally traded in the same way. We will cover that a little later, after we discuss the calculation.
Although it was initially designed for trading equities, the McClellan oscillator has also been adopted in the Forex market. It is used primarily for short-term and mid-term trading, whereas the McClellan Summation Index, which we will cover in the next article, is in the hands of mid-term and long-term traders.
The McClellan oscillator’s calculation involves estimating the 39-period EMA of the difference between the number of advancing and declining issues and the 19-period EMA of the difference between the same two components. The former is then subtracted from the latter. Thus, the formula is as follows:
McClellan Oscillator = [19-Period EMA of (Advances – Declines)] – [39-Period EMA of (Advances – Declines)].
Here is how the McClellan oscillator is visualised on a chart.
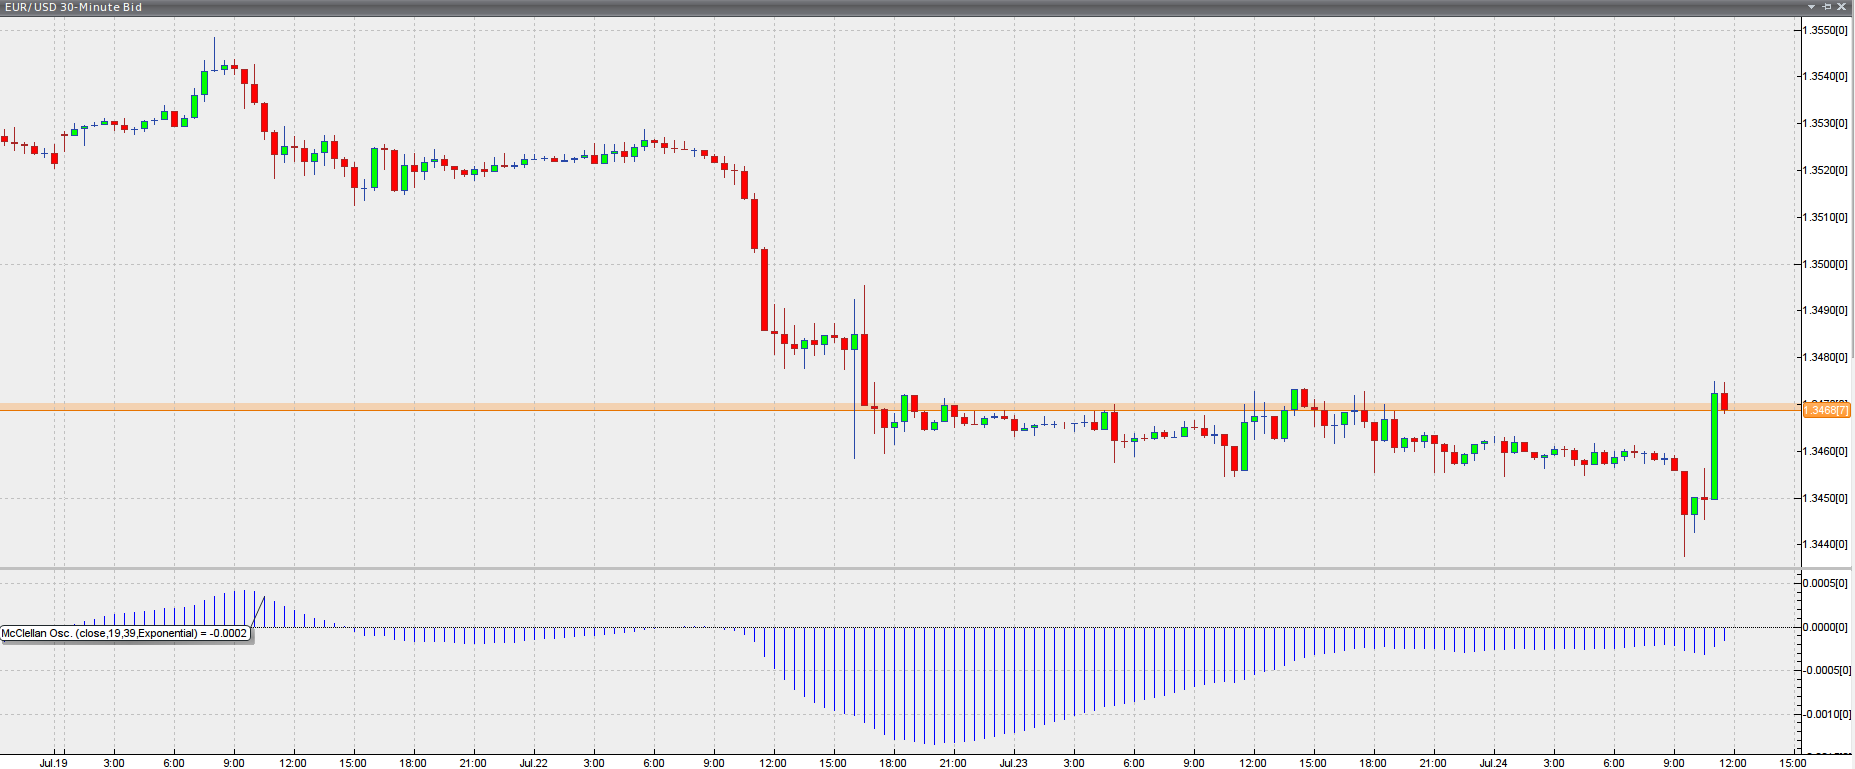
Chart source: VT Trader
Interpretation
 Interpreting the indicator is quite straightforward. It is positive when the 19-period EMA (the faster one) is above the 39-period EMA (the slower one), and vice versa. When the MO is rising, it suggests that the market is generally rising. Conversely, when the 19-period EMA is below the 39-period EMA and the MO is negative, it implies that the market is generally edging lower.
As mentioned earlier, the McClellan oscillator is similar to the MACD and is therefore traded in a similar manner. It generates long/short entry signals when the indicator crosses the zero line, especially during major spikes (also known as breadth thrusts). A breadth thrust occurs when the indicator moves sharply from negative into positive territory by about 100 points or more. A breadth thrust is further reinforced when it is preceded by a bullish divergence.
Traders also watch closely for both classic and hidden divergences between the indicator and price, as well as for overbought and oversold conditions. Divergences often precede moves in the indicator, but a divergence alone is not reliable enough to warrant a trade; further analysis with other tools is required. At the very least, a divergence needs to be confirmed by a strong move in its direction that reverses the previous trend.
A classic bullish divergence occurs when price makes a lower low while the indicator forms a higher low. A classic bearish divergence occurs when price climbs to a higher high but the indicator only reaches a lower high.
A hidden bullish divergence occurs when the indicator makes a lower low while price forms a higher low. A hidden bearish divergence is evident when the oscillator makes a higher high while price remains at a lower high.
The McClellan oscillator can also be used to determine whether the market is overbought or oversold. Overbought conditions are generally signalled when the faster EMA spikes and moves too far above the slower EMA, while the market is considered oversold when it drops too far below the 39-period exponential moving average.
McClellan histogram
 The McClellan histogram complements the McClellan oscillator and helps traders identify divergences and zero-line crossovers. It does so by plotting the difference between the McClellan oscillator and its signal line in histogram form.
It is considered a momentum indicator and, just like the McClellan oscillator, traders can enter the market on zero-level crossovers. Additionally, market participants look for classic and hidden divergences and trade them in the same way as described in the first part of the article. Here is a screenshot of the McClellan histogram.
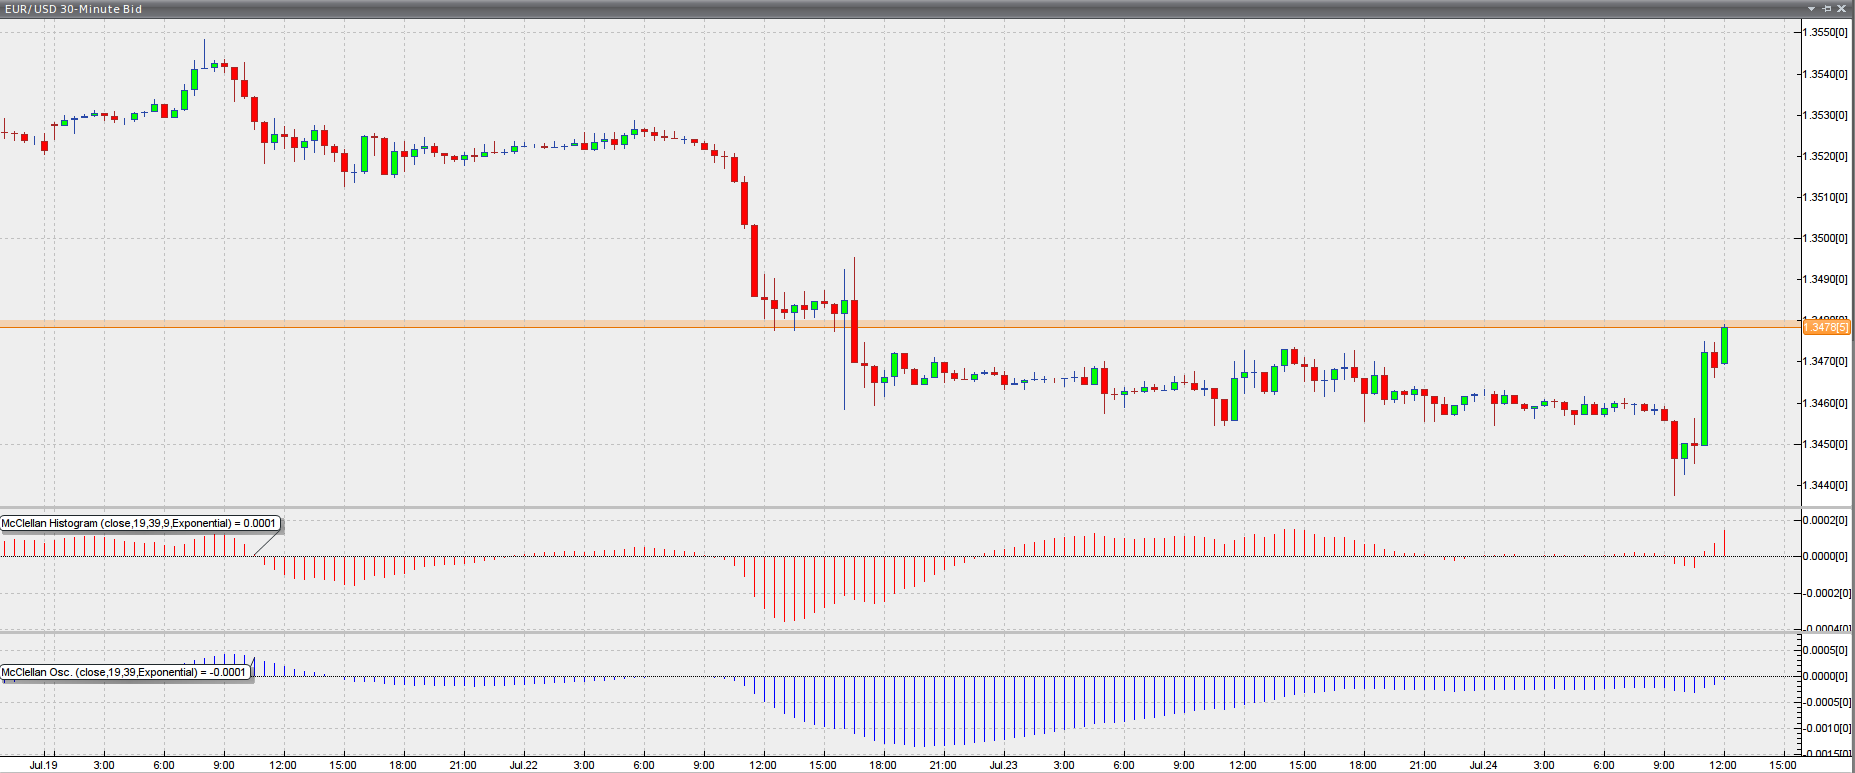
Chart source: VT Trader