Written by ,  | Updated:
Chande’s TrendScore
This lesson will cover the following
- Explanation and calculation
- How to interpret this indicator
- Trading signals generated by the indicator
Described by Tushar Chande in the September 1993 edition of ‘Stock & Commodities’ magazine, the TrendScore indicator makes both quantitative and qualitative assessments of the direction and strength of a trend. It does so by comparing the current closing price of a trading instrument with the closing prices of the previous 20 periods.
The indicator fluctuates between -10 and +10. A reading of +10 implies that a strong bullish trend is in progress, while a reading of -10 implies that a strong bearish trend is in progress. TrendScore readings above zero indicate a bullish trend of varying strength, whereas readings below zero indicate a bearish trend of varying strength.
Plus500 US Best Futures Broker
Highest-rated broker among traders- Trade Forex
- Trade Crypto
- Trade Stocks
- Regulation: NFA
- Leverage: Day Margin
- Min Deposit: $100
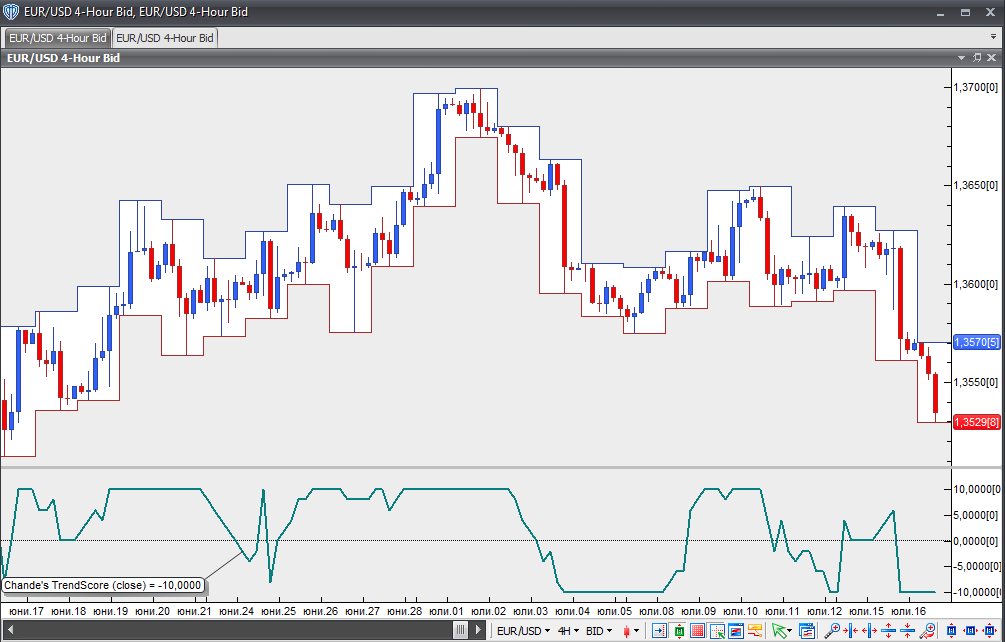
Chart Source: VT Trader