Failure of patterns
This lesson will cover the following
- General thoughts on failed patterns
- Common mistakes
- Failed trend and trend channel lines
Very often patterns will fail and confound traders’ expectations. Other times the failure itself can fail, thus forming a second entry, which is regarded as a more reliable signal. Due to the high frequency of these failures, it is crucial for traders to learn to accept these unexpected events as normal and adapt as soon as possible to avoid further losses or missed profits.
Failures are often very profitable opportunities for opposite-direction traders, who take advantage of trapped players that were forced out of the market and will refrain from re-entering in the same direction for some time. This, coupled with traders who are still trapped and decide to exit their positions, thus contributing to the counter-movement, makes the market one-sided and adds to the counter-traders’ benefits.
This effect is diminished if the initial price movement reaches the scalpers’ target and then reverses. Upon hitting their profit target, many scalpers will take profits and exit their full positions, or leave a small swing portion with a break-even stop. Because most of them are now out of the market and there are fewer trapped traders anxious to exit with a smaller loss who would fuel a counter-move, a price reversal will have less momentum.
Common mistake
 One of the most common minor reversal failures, which tends to cause small but persistent losses to novice traders, occurs when they enter with-trend during a weak correction above a bar that has extended above a previous counter-trend bar. For example, during a pullback or a trading-range pause within a weak bull trend, many traders will expect that when a with-trend bar extends above a previous counter-trend bar, this might mean the trend is continuing. They will then buy on a stop above that with-trend bar’s high.
- Trade Forex
- Trade Crypto
- Trade Stocks
- Regulation: NFA
- Leverage: Day Margin
- Min Deposit: $100
Smart traders, however, will anticipate this and seize the opportunity to trap those with-trend traders. If enough market players carrying significant volume decide that the pullback has not yet extended enough, especially if a second leg of an alleged two-legged pullback still hasn’t occurred, those smart traders might go short above that very same with-trend bar. If their volume is high enough to offset the new longs, they will push the market down by several pips.
Although the price drop makes it even more attractive for bulls, they will feel weak from a psychological point of view. They will begin doubting their judgement, asking themselves why more longs didn’t follow them. If no new bulls enter the market, this will keep the price at the same lower level, or it will even be pushed down further, additionally pressuring trapped bulls. The more time the market spends inactive or dropping, the more anxious long traders will become, and eventually they will cut their losses and exit. As the market grinds lower, more shorts will enter (some of them will be the previous bulls), while the original shorts may scale further in, which in turn will keep bulls away from the market for some time. In the absence of buyers, the price will continue to decline until it reaches a point where sellers will want to secure profits and exit, cushioning the fall. As soon as a stall in momentum is evident, those bulls who were in waiting mode will re-enter the market and the reverse scenario will likely unfold.
Failed trend and trend channel lines
 As you know, trend lines and trend channel lines tend to act as fairly robust support/resistance levels, especially when it comes to major trend lines. Usually they manage to contain the price momentum and act as reversal points as the market bounces up and down within the trend channel. Occasionally, however, they will fail and be broken. Trend-line breaks suggest that counter-trend traders are gaining strength and are precursors of a shift in momentum, while trend-channel-line penetrations mean that the trend is accelerating.
Failed breakouts (rebounds from a trend line) are basically pullbacks and reliable with-trend setups. You won’t see the trend line failing in its support role often (the reversal actually succeeds and breaks the trend line), but when that happens, it traps a large number of with-trend traders. Moreover, such successful counter-trend breakouts are usually very steep and lead to a trend reversal. Although reversals fail much more frequently than they succeed, these low-probability trades yield large profits for the traders who get them right. Of course, these entries involve high risk because often a trend-line break will lead to the resumption of the old trend and a test of its extreme, which is why inexperienced traders should avoid counter-trend entries before a reversal is definitively confirmed. Check out the following example.
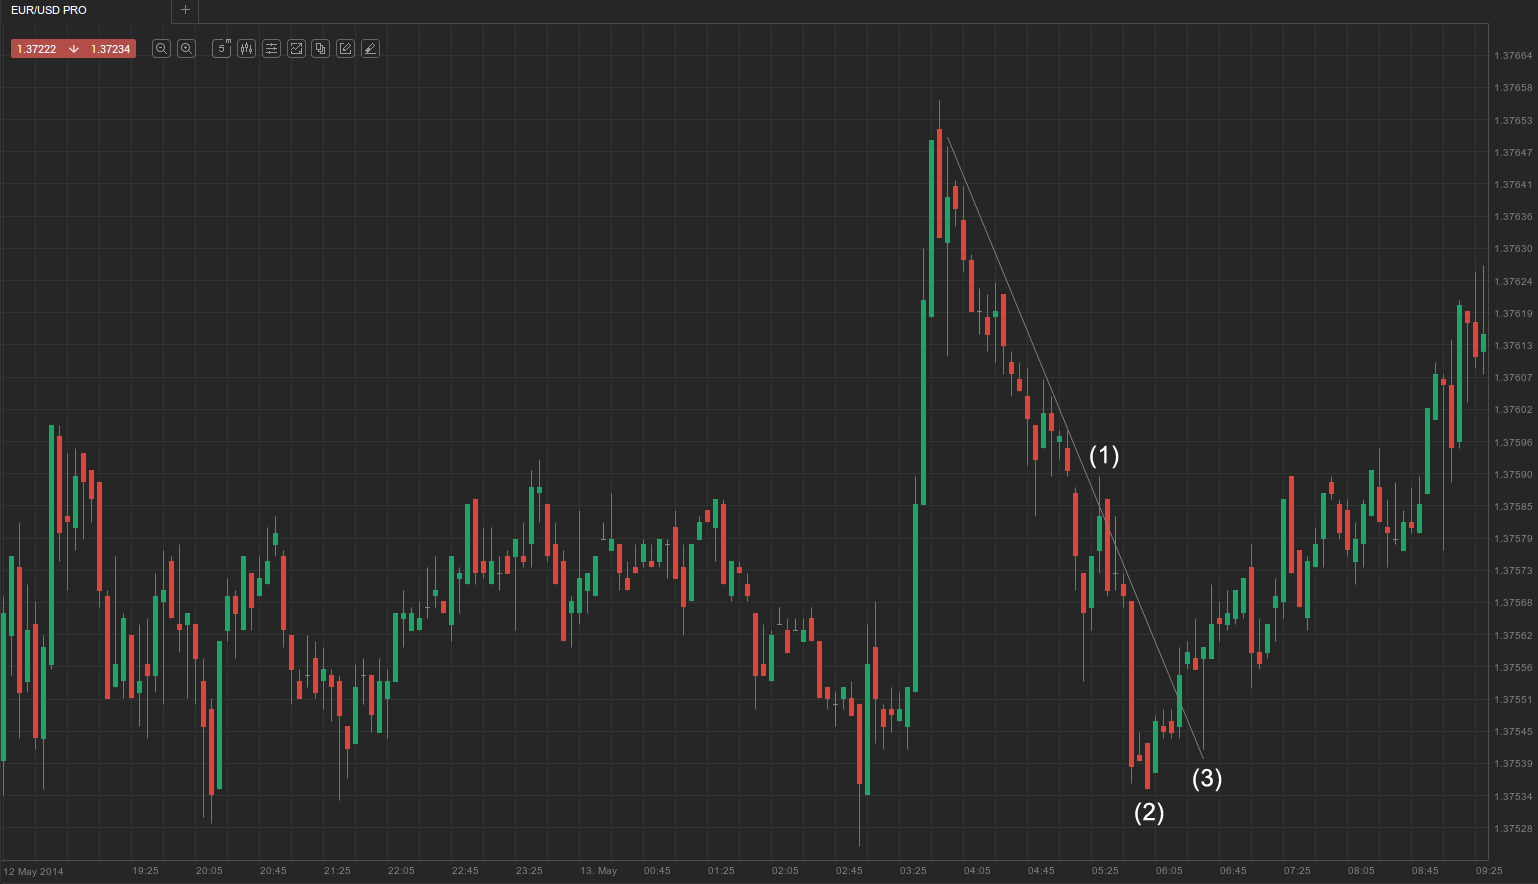
On the screenshot above you can see that the market reversed into a strong bear trend after three consecutive buy climaxes. This was an expected outcome after the market had been trading sideways for several hours and the strong buy-out almost doubled the session’s average range. As we know, a succession of climaxes greatly increases the chance of a trend reversal compared with what a single climax could incur. After the market had reversed, its downward move continued for 30 bars. The best-match trend line was tested three times and a micro trend line was broken (not illustrated) before the major trend line was overshot at (1). Despite being penetrated, it managed to contain the price movement and there was no gap bar, but, as expected, momentum afterwards accelerated to a new trend extreme, although it didn’t manage to beat the session low.
As we’ve already explained in the article “Further Talk on Pullbacks“, pullbacks penetrating the major trend line are the strongest ones, and usually precede an acceleration to a new trend extreme before ultimately leading to a trend reversal. The same happened here. The trend line failed to contain price momentum and was broken by a strong bull trend bar. As it often happens, there was a successful pullback testing the trend line at (3), rendering the trend-line breakout a failed failure, thus a second entry point (which, as we know, is one of the most reliable with-trend entry points). The market is expected to correct with at least a two-legged move up from bar (2) and the correction is expected to last for more than an hour. You could enter long above bar (3) or at the next pullback.
Trend channel line breakout
Conversely, when a trend-channel line fails to contain the price action and is penetrated, this is evidence that the trend might be much stronger than most traders had initially expected, providing additional incentive for with-trend entries.
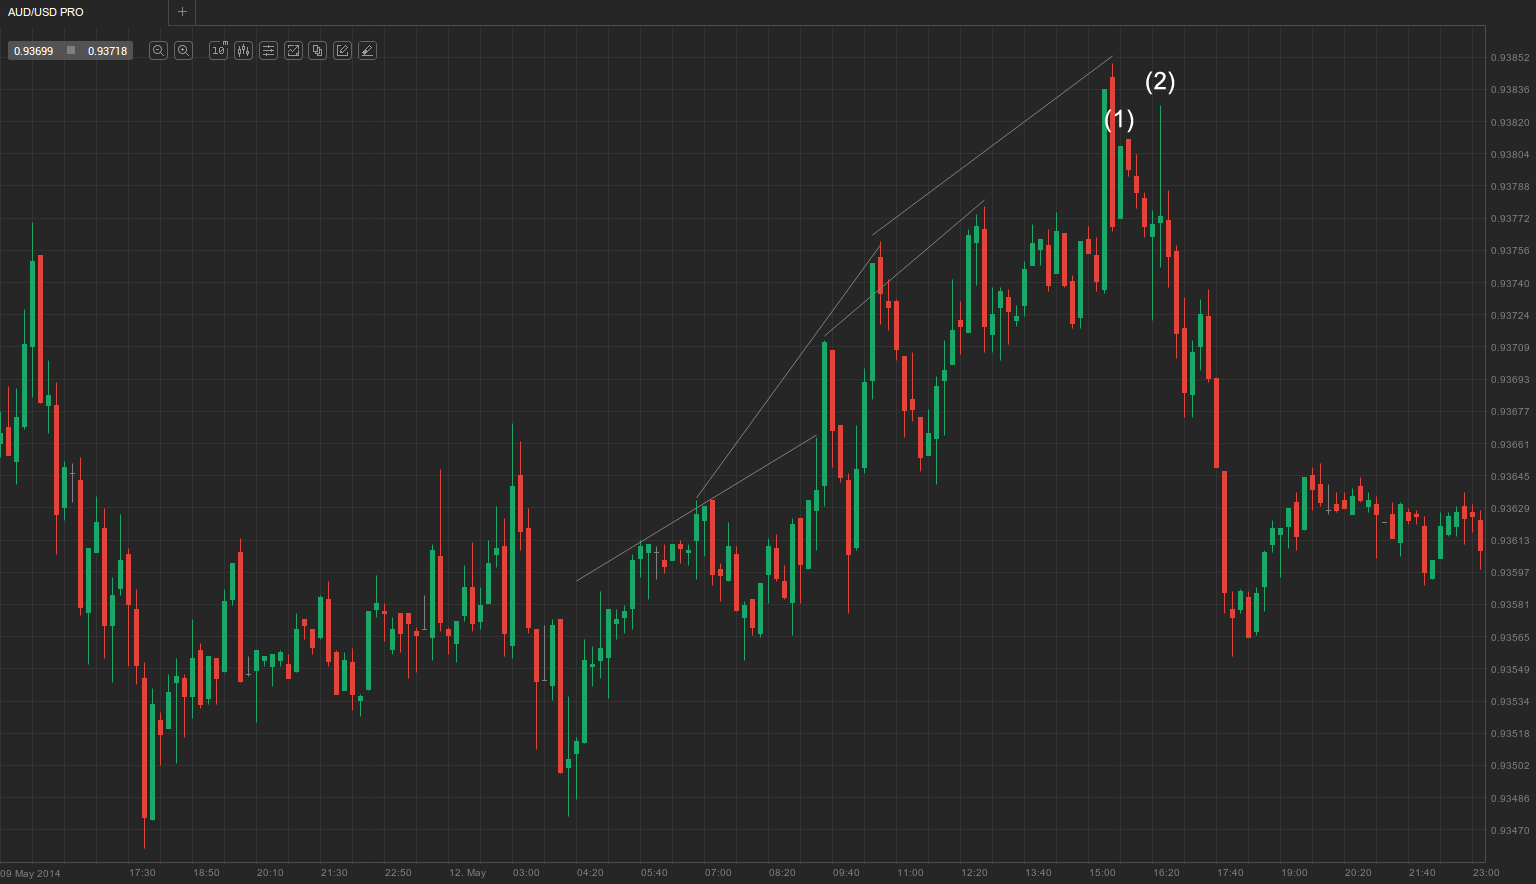
On the screenshot above you can see a strong trend, which should mean only one thing – with-trend positioning. However, many traders would be deceived into placing counter-trend bets as they see the constant redrawing of trend-channel lines, thinking that the trend is showing signs of climactic exhaustion and will end soon. What is actually happening is that the trend-channel line fails to contain the market movement and its break signifies an acceleration of the trend. Instead of focusing on plotting multiple trend-channel lines in order to guess where a reversal will come, a smart trader will enter long on each pullback, scalp their profit target and swing a part of their position as the trend grinds higher until a clear reversal is evident and confirmed.
In our case, the uptrend ended with a two-bar reversal. Bulls then tried to push the market up, as evidenced by the double-shaved bull trend bar at (1), which, however, had no follow-through and was reversed by three consecutive bear trend bars. Confirmation of the bulls’ inability to retain control came after they unsuccessfully attempted to reverse those three bear bars, forming a huge doji bar at (2). Bulls who entered above the previous bar were trapped, and as soon as the bears had overcome them, they were forced to cut their losses below the doji bar, pushing the market further down.
A smart trader will always look for possible traps that may catch their fellow colleagues off-guard, allowing them to capitalise on these mistakes. When a pattern fails, which happens on a regular basis, trapped traders tend to exit at a minimal loss, usually several pips below the entry or signal bar. This is a suitable entry point for those who didn’t fall for the trap. They will place entry-stop orders at exactly the same price level where trapped traders have placed their protective stops. As the smarter traders enter, the trapped ones exit the market and typically avoid going long, for example, until the market displays strong enough buying pressure. This secures one-sided market movement for the smarter short traders, who will at least aim for a scalper’s profit.
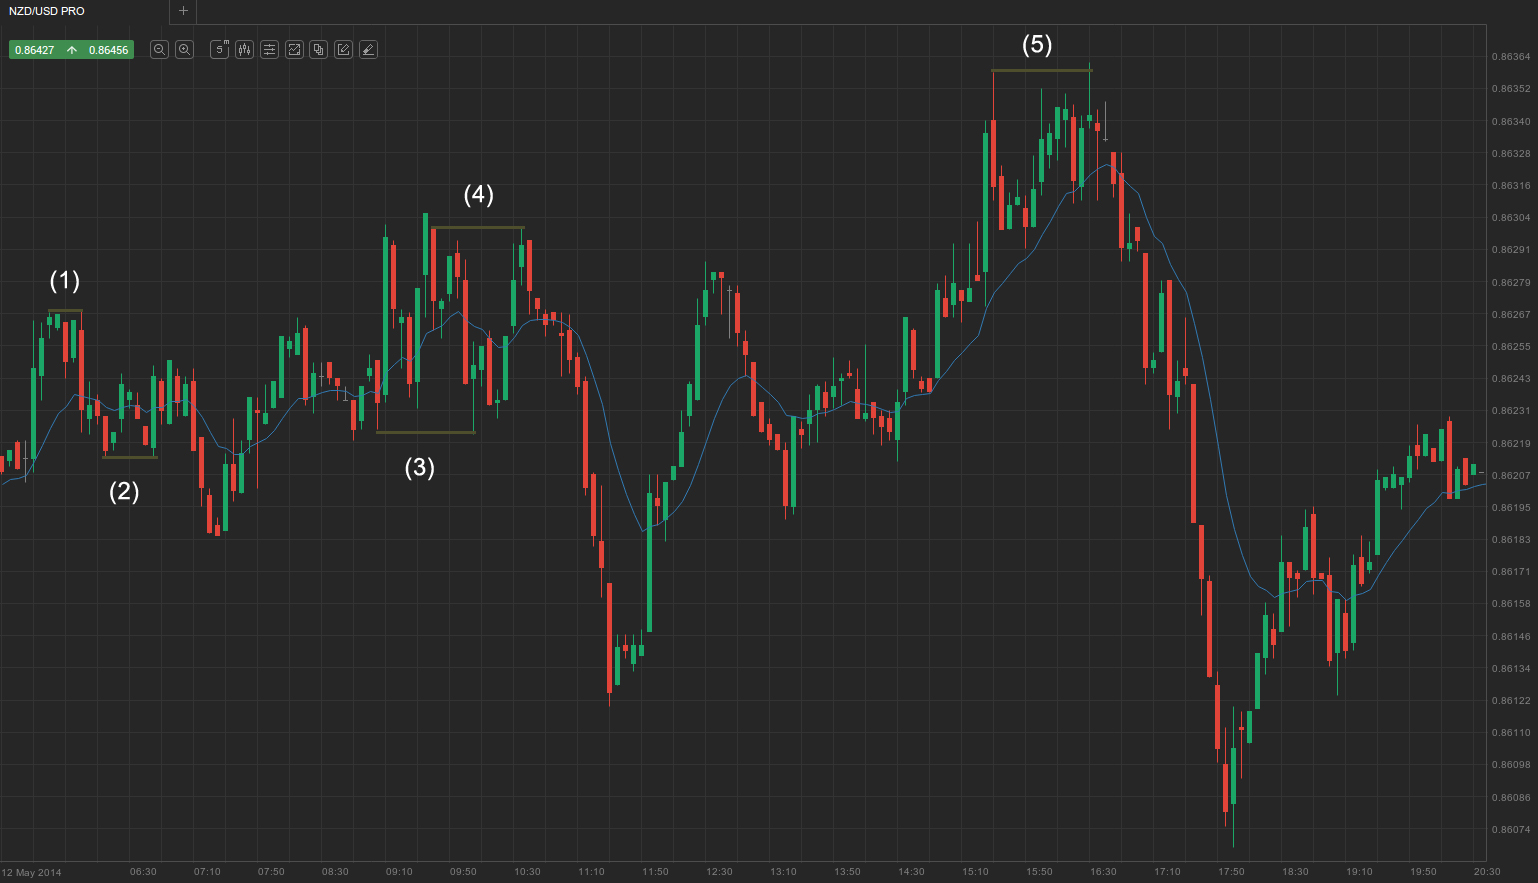
On the screenshot above you can see examples of failed double-top bear and double-bottom bull flags, alongside successful ones. At (1), the market formed a failed double-top bear flag, which was followed by the formation of a failed double-bottom bull flag at (2). The market then formed a very tight trading range at the moving average, essentially signifying that the market is in a balanced state and will stay that way for some time to come. Another example of a failed double-bottom bull flag was the two bars at (3), since the ensuing rally only managed to push the price within the boundaries of the already established trading range. However, the double-top bear flag at (4) was successful, as evidenced by the subsequent decline, and so was the double-top bear flag at (5).