Double bottom pullbacks
This lesson will cover the following
- What they are and how to interpret them
- An example
If a double bottom forms after a decline in prices and a pullback tests the area slightly above the double-bottom low, this is called a Double Bottom Pullback setup for a long trade. There have been two attempts to move to the downside, but on both occasions the bulls overpowered the bears at roughly the same price. The double bottom does not necessarily need to be perfect, as we discussed in our Forex Trading guide. If the second bottom fails even to reach the first, there is a chance that the pattern may instead produce a two-legged sideways or upward correction. The trader should now look for an opportunity for a long scalp rather than a long swing.
The Double Bottom Pullback setup can also be considered a Triple Bottom, as the third move to the downside is not sufficiently strong to form a new low. There is another way to view this setup – as two failed attempts to surpass the prior extreme level, which usually cause a reversal.
Some technical analysts believe that triple bottom and triple top formations invariably fail to lead to a reversal and thus become continuation patterns. However, this requires the three extremes to reach identical price levels, which is rare.
The Double Bottom Pullback setup leads to a reversal, unlike the Double Bottom Bull Flag, which is a trend-continuation setup. Both provide opportunities for long entries, but the first signals the start of a new trend, whereas the second occurs within an existing trend (or after at least one strong leg of a trend).
- Trade Forex
- Trade Crypto
- Trade Stocks
- Regulation: NFA
- Leverage: Day Margin
- Min Deposit: $100
The mirror image of this setup is the Double Top Pullback, which consists of a Double Top in an uptrend followed by a pullback that tests the area slightly below the double-top high. The Double Top Pullback is a setup for a short trade.
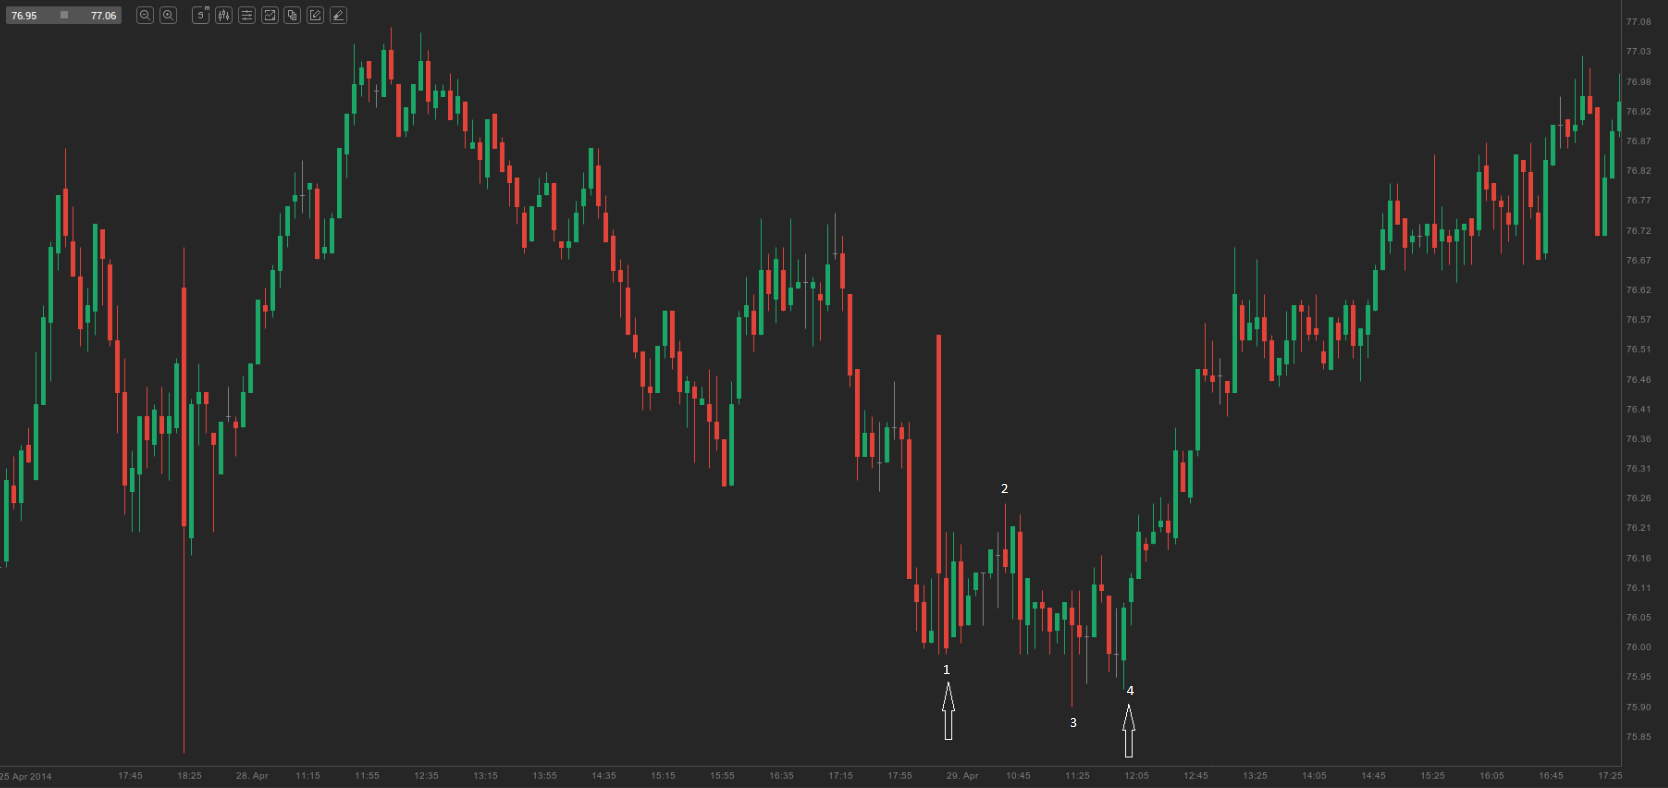
On the 5-minute chart of ADS above, bar 4, an outside bar, was also a signal bar for a long entry, while the entire pattern formed a Double Bottom Pullback. The low of bar 3 was slightly below that of bar 1, which is preferable in these patterns.
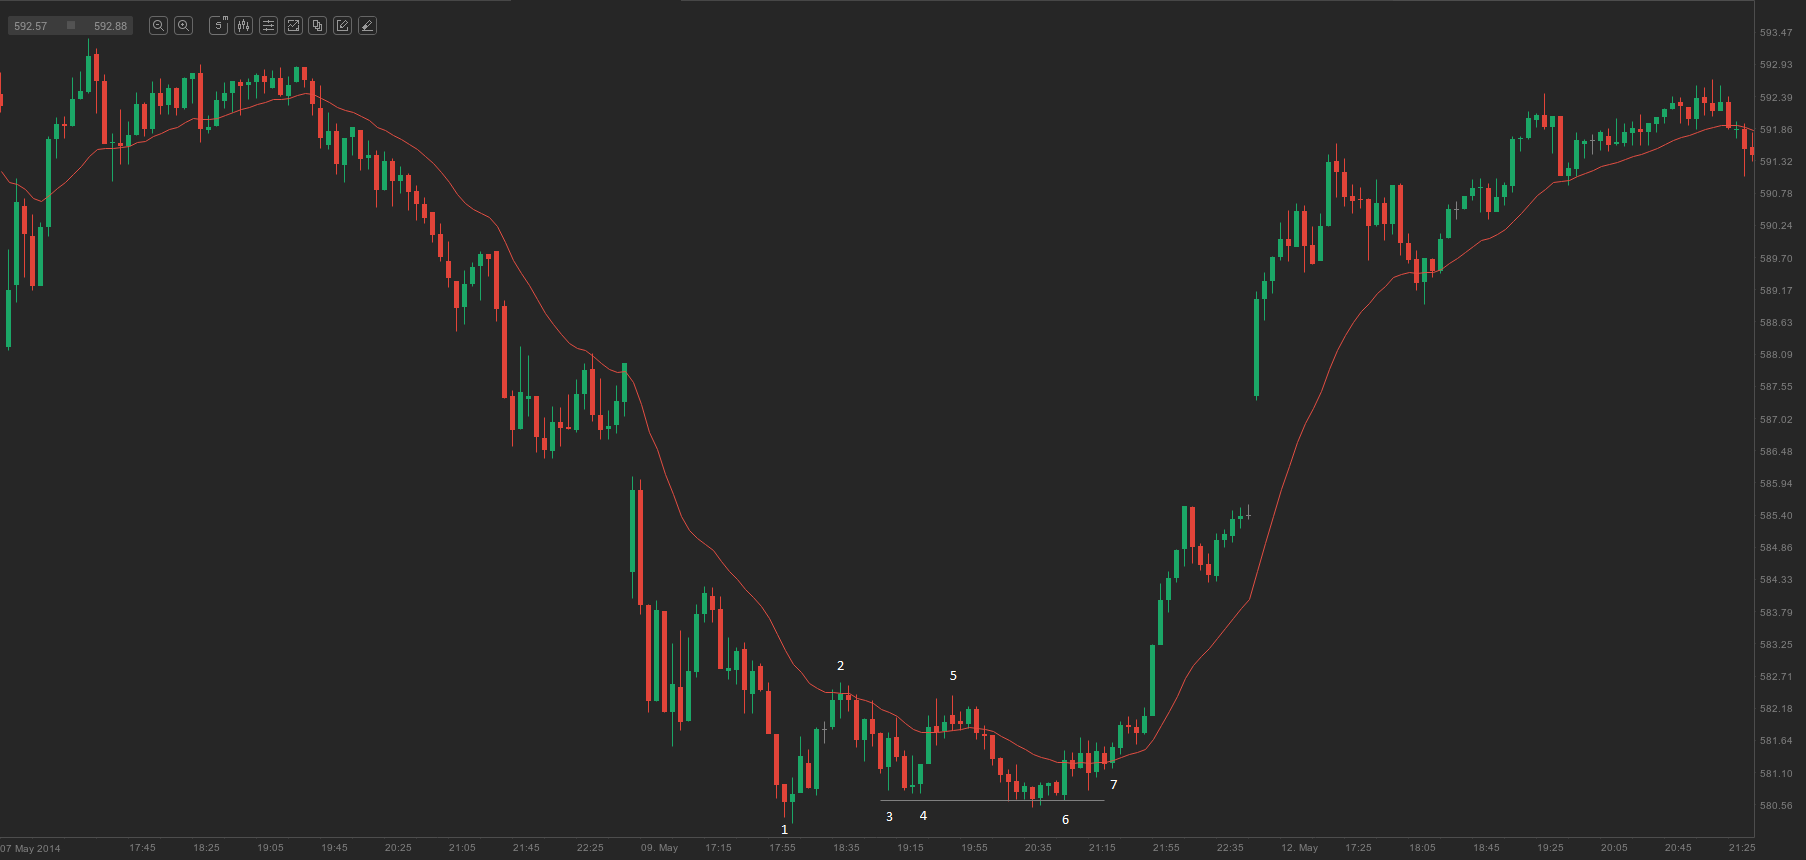
On the 5-minute chart of AAPL above, bar 1 marked the end of a steep second leg to the downside and was a probable reversal setup. Although the move up to bar 2 was small, neither the low of bar 3 nor that of bar 4 managed to undercut the prior low, and these two bars produced a small Double Bottom Bull Flag. The low of bar 6 was slightly lower than that of bar 3 but still failed to break the low of bar 1; consequently, bars 3 and 6 formed a larger Double Bottom Bull Flag. Institutional traders were probably defending the low of bar 1 rather than attempting to trigger protective stops, which could indicate that they expected the price to rise. Bar 7 was an M2B setup.