Counting bars in order to detect end of corrections
This lesson will cover the following
- Bar counting – High/Low 1, High/Low 2
- Variations of bar counting
- M2B and M2S setups
A good indication that a pullback during an uptrend or a trading range has ended is that the high price of the current bar moves at least one tick above the high price of the prior bar. This allows a trader to count the number of attempts for this to occur.
High 1, high 2
 During a sideways or downward move within an uptrend or a trading range, the first bar whose high is above the high of the preceding bar is known as a High 1. This brings the first leg of the sideways or downward move to a halt. If prices fail to begin a bull swing and continue sideways or lower, the next time a bar appears with a high above that of the previous bar it is a High 2. This ends the second leg. A small break of the trend line is required between the High 1 and High 2, signalling that trend trading is still present. If no break occurs, a trader should not rush to go long, because the High 1 and High 2 may simply be part of the same initial move down.
During a strong bull swing, the High 2 entry may be at a higher level than High 1. Conversely, during a strong bear swing, the Low 2 entry may be lower than Low 1. Sometimes pullbacks may even create a High 3 and a High 4.
- Trade Forex
- Trade Crypto
- Trade Stocks
- Regulation: NFA
- Leverage: Day Margin
- Min Deposit: $100
Low 1, low 2
 During a sideways or upward move within a downtrend or a trading range, the first bar whose low is below the low of the preceding bar is known as a Low 1. This marks the end of the first leg of the sideways or upward move. If prices fail to begin a bear swing and continue sideways or higher, the next time a bar appears with a low below that of the previous bar it is a Low 2. This ends the second leg. Subsequent similar occurrences will be marked as Low 3 and Low 4. If the Low 4 fails (a bar moves above the high of the Low 4 bar), it indicates that sellers are no longer dominant, and the market will probably either enter a trading range or buyers will take control. Sellers can best demonstrate that they have regained control if they manage to breach a bull trend line with considerable momentum.
Changing the view
 Often the market continues to retrace instead of reversing, so a trader will need to adjust their perspective. For example, suppose a trader believes the market has formed a trading range with a strong new high and a Low 2 develops above the prior high, but instead of plunging the market continues to rise. The trader should then look for appropriate High 1 and High 2 entries. The continued rise suggests the move has sufficient strength, so the trader should focus on long setups only.
There are cases when, in a sideways movement, one can spot High 1, High 2, Low 1 and Low 2 within ten bars. As the market is in a range, neither buyers nor sellers manage to dominate sentiment for more than a short period. Therefore, it is logical to expect that both sides will continue to attempt to gain control and, in doing so, bull and bear formations will likely appear.
Variations of bar counting
 Although there are variations of bar counting, the main objective remains the same – to detect two-legged retracements. During a strong uptrend, a two-legged pullback may form and have a High 1 only. If one or two bearish closes appear, they may be considered the first leg down, even if the next bar does not move above the high of the bearish bar. If the following bar is bullish but its high remains below the trend high, it may be considered the end of the first leg down, provided that the next bar is bearish again. If this subsequent bar moves below the low of the bullish bar, then within the next several bars a trader should look for a bar that exceeds the high of its previous bar; this would complete the two legs to the downside.
By considering each bar as a possible signal bar, a trader may place a stop order to buy at one tick above its high. Once the order is filled, the trader now has a variation of a High 2.
Most reliable high 1 and low 1 entries
 The most reliable High 1 and Low 1 entries occur on failed breakouts from micro trend lines, as the latter represent the trend segments with the greatest strength. One-bar or two-bar failed breakouts that form High 1 pullbacks in an uptrend and Low 1 pullbacks in a downtrend provide very good opportunities to scalp in the direction of the trend. Such entries are also appropriate when a huge move far beyond the exponential moving average occurs, followed by a High 1 pullback in an uptrend or a Low 1 pullback in a downtrend back to the moving average. In this case a micro trend line may not necessarily be present.
Trending highs and lows
 Every trend has trending highs and lows. During an uptrend, each low usually exceeds the previous low (higher low), while each high exceeds the previous high (higher high). During a downtrend, each low is usually below the previous low (lower low), while each high is below the previous high (lower high). Therefore, a trader usually intends to buy a higher low during an uptrend (on a pullback) or buy a higher low in a downtrend (a move against the trend, in anticipation of a reversal, for example). Conversely, the trader generally intends to sell a lower high during a downtrend or sell a lower high in an uptrend. When a trader enters against the trend, they should scalp most or all of the position. An exception is when a strong reversal occurs.
Example of bar counting

On the 5-minute chart of AAPL above, a High 1 appears during a sideways or downward leg of an uptrend and is the first bar to form a high above the high of the prior bar. If the next bar has a high lower than that of the previous bar, the subsequent occurrence of a higher high is the High 2. Then a High 3 forms. Counting beyond four usually cannot provide a trader with a reliable signal, because the pullback may have gone far enough to be viewed as a trend in the opposite direction.
A Low 1 also appears during a sideways or downward leg of an uptrend and is the first bar to form a low below the low of the prior bar. Low 2 and Low 3 are the next similar occurrences.
It is worth noting that when there is a straightforward move to the upside, a trader should not look to go short on most Low 1 and Low 2 setups.
M2B, M2S setups
When a High 2 or a Low 2 occurs and one or more of the bars come into contact with the exponential moving average, such situations are known as M2B (moving average, second entry, buy setup) and M2S (moving average, second entry, sell setup). These setups are quite reliable, especially during strong trends (many traders consider two-legged pullbacks to the exponential moving average in a strong trend to offer excellent trading opportunities).
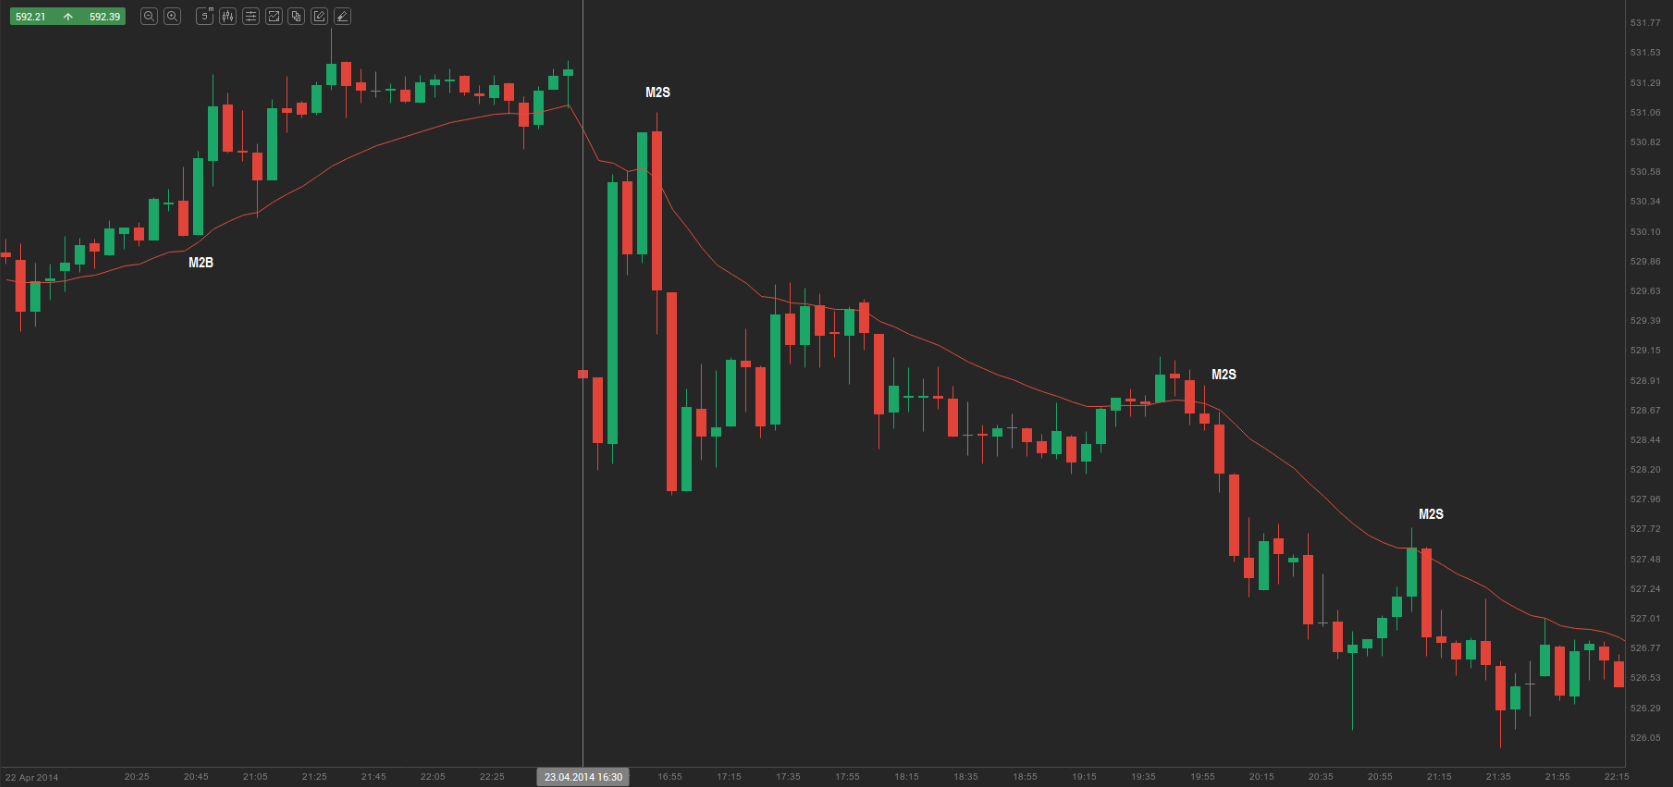
On the 5-minute chart of AAPL above, bar 1 was an M2B entry, while bars 2, 3 and 4 were M2S entries.