Breakouts
This lesson will cover the following
- What is a breakout?
- What does a trader need in order to confirm a breakout?
- Can a breakout be expected?
these methods, which we mentioned above, do h
As we already discussed, in order to maximize his/her profit, a trader should join a trend as early as possible, when it is safe, and follow it until it signals a change in direction against him/her. A trend will often begin from a breakout of a support or resistance levels and sometimes from a trend line.
What is a breakout?
 In trading a breakout occurs most often, when a price breaks above a prior level or zone of resistance and heads higher or a prior level or zone of support and heads lower. A breakout usually indicates a considerable change in supply and demand for a tradable instrument and also that a new trend is probably beginning. This is exactly what makes breakouts extremely vital signals for traders.
A breakout in the direction of the prior trend serves as a confirmation that this trend is still valid, while a breakout in the opposite direction of the prior trend implies that this trend is probably reversing and that a trader should close his/her position (and probably reverse it).
Usually there should be a trade-off between speed of action and conviction. Speed of action is important as a market price breaks a specific level (support or resistance), while conviction is needed in order to make sure the breakout is real, because false breakouts are commonly observed.
What does a trader need in order to confirm a breakout?
 The first circumstance for a breakout is a penetration of a prior trend line or support (resistance) zone, while the second is a confirmation that this penetration represents a real breakout and not the so called fakeout.
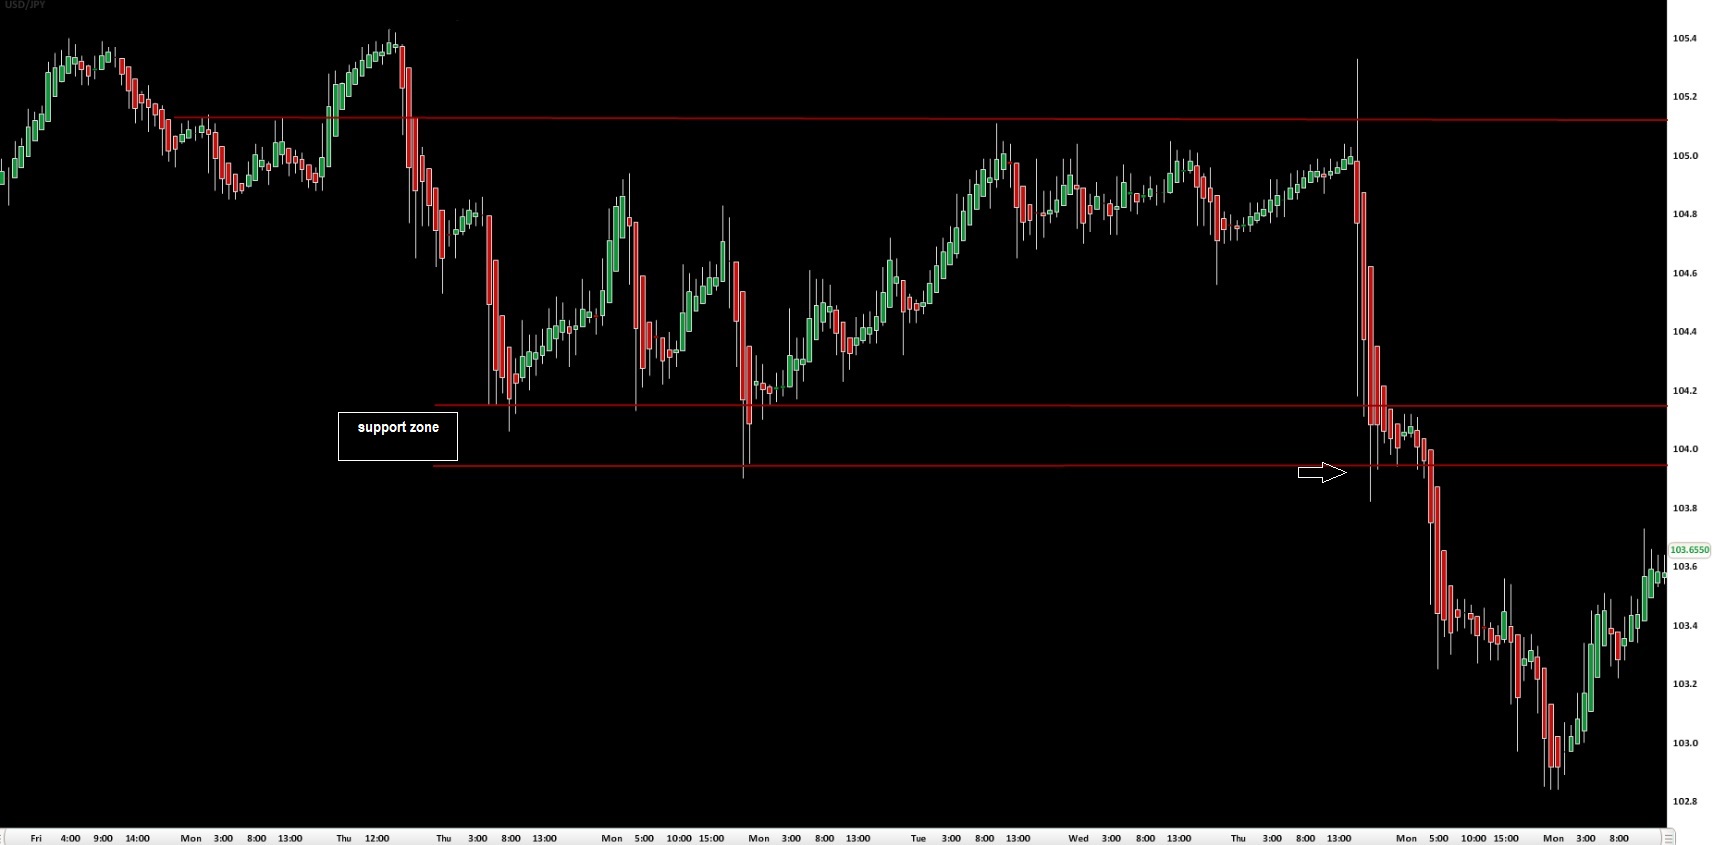
When we have a support or a resistance zone, the exact breakout level remains unclear. In this case the extreme level of the respective zone is usually considered as the breakout level. This is often observed when prices trade in a range (sideways trend), where support zone (a series of horizontal lines showing previous support levels) is wide. In a trading range the lowest support line is usually considered as the breakout level. Prices usually lose momentum, when entering the support zone, and do not break through it entirely. But yet, a break of the lowest support level means that the entire support zone has been compromised. This can be observed on the following graph.
A trend line serves as a more specific breakout level, as it is simply a line. However, a penetration of the breakout level or a trend line needs to be confirmed.
Some traders would wait for the close of the candle where the breakout occurred, while others would wait for more than one candle to close (above the resistance or below the support level).
A third group of traders would wait for the price to move a certain number of pips beyond the breakout, using the Average True Range (ATR), an indicator, which we shall discuss later.
Another confirmation method is to establish a breakout zone a certain percentage beyond the breakout level. In case the price penetrates the breakout level and the established zone beyond it, then the penetration must be real. Any percent can be used as a signal, but the most commonly used is the so called 3% rule, a level standing 3% from the breakout point (which refers to the stock market practice).
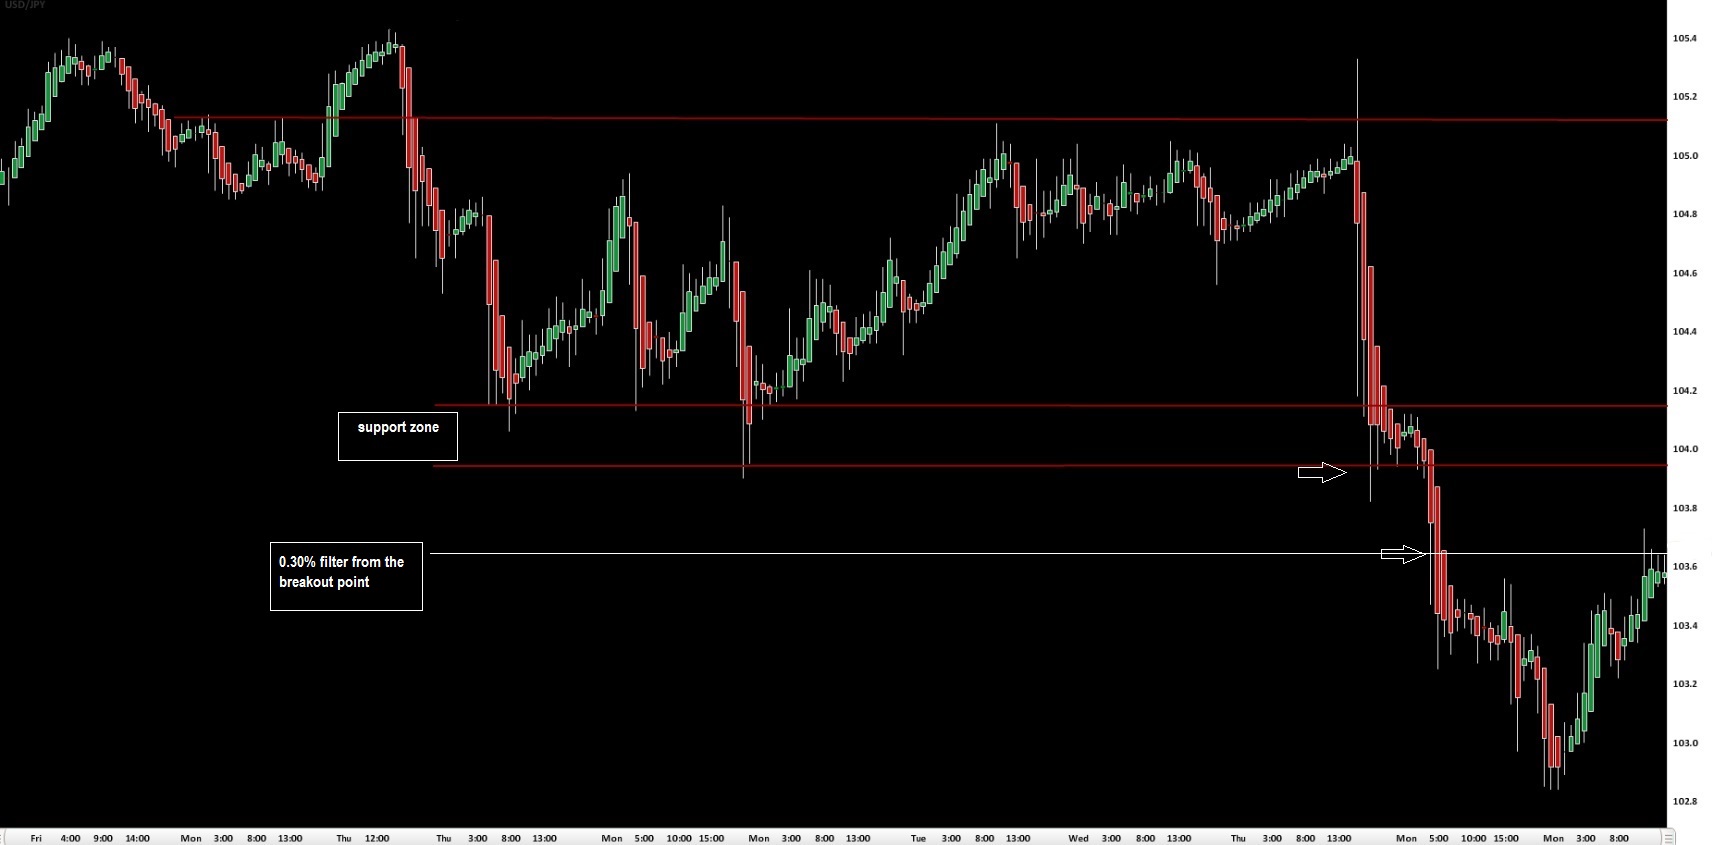
Here we experiment with a 0.30% filter from the breakout point on 1-hour graph of USD/JPY, in order to confirm that the breakout is real.
Volume as confirmation
 Volume can also be used in order to confirm whether a breakout is real. Increased volume of trading can often occur with a breakout. Heavy volume indicates that traders are acting in the direction of the new trend and that there is power behind the penetration. This is so, as rising prices and rising volume are good signals of a healthy uptrend, while falling prices and rising volume are good signals of a healthy downtrend.
Volatility as confirmation
 All these methods, which we mentioned above, do have a significant drawback – they do not account for price volatility. There are three most used means, with which to measure volatility – beta, standard deviation of a price and Average True Range.
Beta refers to the calculation of the standard deviation of a price relative to a certain market benchmark, usually the S&P 500 index. Betas use has decreased over the years, because the assumption it is a valid measure of risk has been questioned. However, it has a certain advantage, as it eliminates the market trend from the volatility calculation.
Standard deviation of a price encompasses a series of prices over some time period in the past. It has also become less useful as a breakout filter in time, because it includes the market trend in its evaluation.
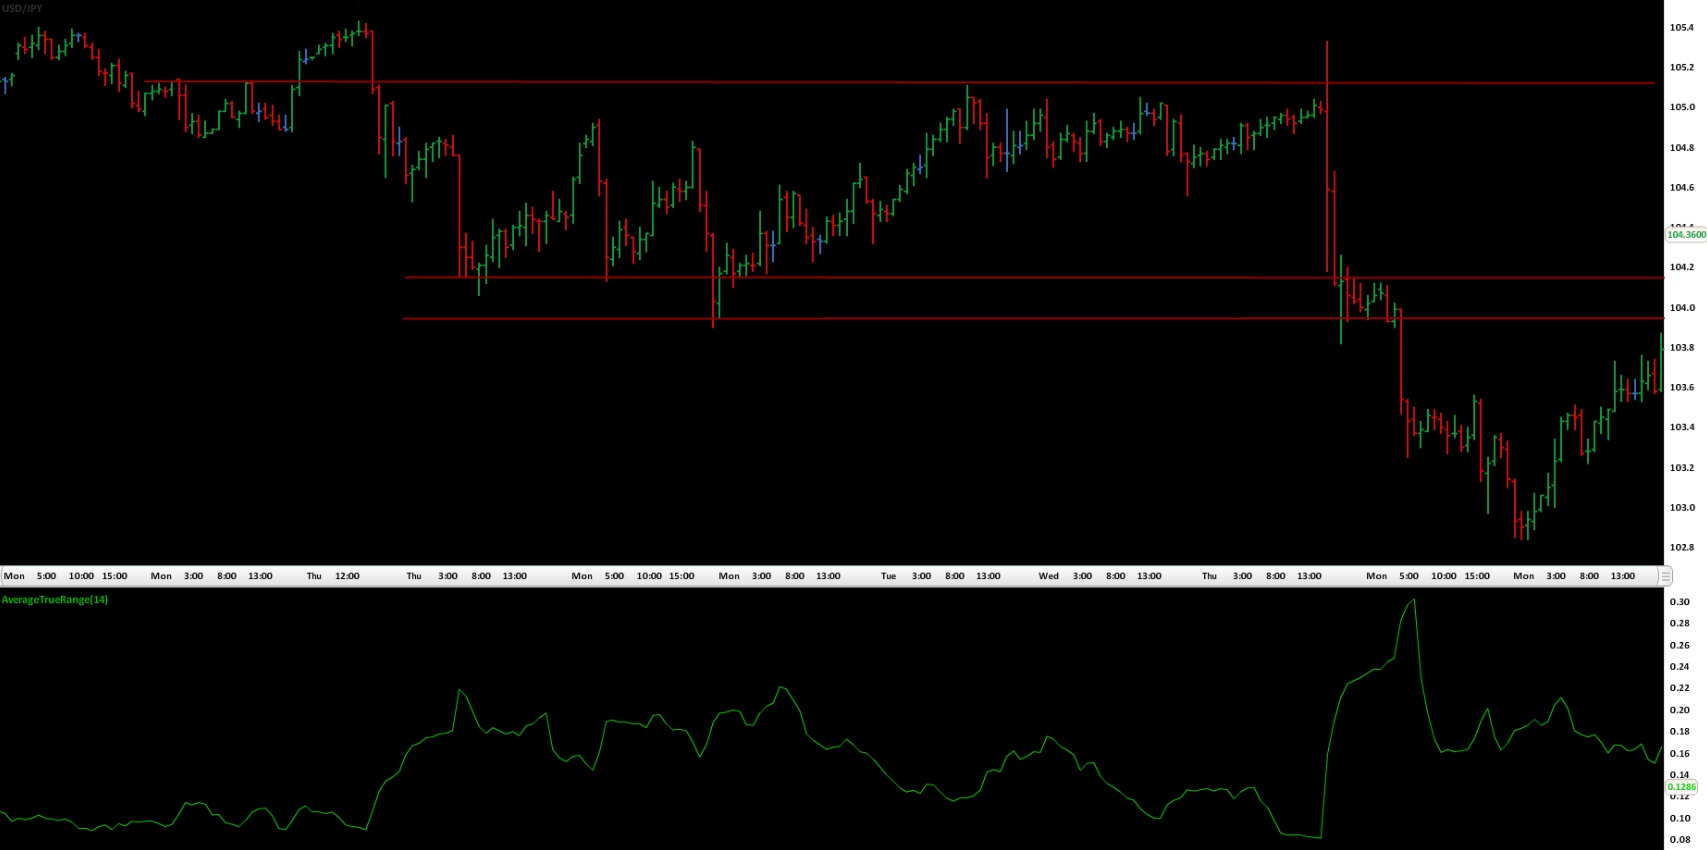
 Average True Range (ATR) is related to the Average Range, which represents the average of the difference between each bars high and low during a certain period in the past. ATR is an average of the True Range bars close. The True Range is the greatest of :
1) the difference between the current bars high and low
2) the absolute value of the difference between the previous bars close and the current bars high
3) the absolute value of the difference between the previous bars close and the current bars low
The ATR is the average of the True Range over some period of time. As a price filter for confirmation of a breakout, when using a multiple of the ATR, the breakout level is adjusted in accordance with volatility. The ATR filter can expand and contract in time, following the change in price volatility. In case volatility of prices rises, daily True Ranges will expand and the ATR will be greater. This means there is a lesser chance for a fakeout to occur because of the increased price volatility.
Can a breakout be expected?
 Very often a trader can use volume as a clue that a breakout is about to occur, because volume is tightly related with the trend itself. If trading volume rises with a trend, this will appear supportive of the trend itself. When prices are fluctuating beneath a zone of resistance, for instance, and trading volume rises on every small up leg and declines on every small down leg, there is a chance that the price may break through the resistance zone.
Prices may also indicate their next directional move. When we have a trading range, in case prices start to reverse upward and slightly above the lower boundary of the trading range and then reverse downward at the zone of resistance, this may signal that long position holders are becoming a little more aggressive with every minor correction. If the tendency to have little rising lows comes with rising volume on each rally, the chance of a breakout through the zone of resistance increases.