Labour market
You will learn about the following concepts
- Definition and scope
- Fundamental indicators related to the labour market
- Non-farm Payrolls
- Unemployment rate
- Initial Jobless Claims
- Other indicators…
When we speak of an economy and economic growth, most people who are not familiar with the matter often picture wealth and a high standard of living. Although this is also true, national prosperity comes as a result of an advancing and politically well-led economy, which derives its strength from solid underlying components.
The foundation and key driver of economic expansion is the labour market. Stable employment keeps an economy spiralling upwards and makes it less susceptible to shocks, allowing it to continue growing even during a global financial crisis and retain a high standard of living. Not only does a high unemployment rate mean that more people are jobless and without income, but an unhealthy labour market also leaves an economy dominated by uncertainty. This would be reflected in consumer sentiment and would lower consumer spending, which makes up a major part of the Gross Domestic Product of a country. This is why, for example, the Federal Reserve has made lowering the unemployment rate in the US a major requirement before trimming its quantitative easing programme, which has been a key driver of growth over the past five years.
Definition and scope
 By definition, the labour market is the nominal marketplace in which able-bodied people find paid work, employers look for willing workers, and wage rates are determined. Some governments have set minimum wages, below which full-time salaries cannot fall, while others refrain from introducing such a measure.
According to their scope, labour markets can be local, national, or even international. Typically, countries that have not struck any trade agreements or other accords for co-operation between them have strict visa policies, which restrict the free movement of people and also impose labour-market limitations on foreigners. Conversely, some countries have signed agreements to ease the flow of people between them, thus forming a completely free international labour market. The clearest example is the European Union.
- Trade Forex
- Trade Crypto
- Trade Stocks
- Regulation: NFA
- Leverage: Day Margin
- Min Deposit: $100
Labour markets consist of smaller, interacting segments for different qualifications, skills and locations – much like the great variety of employees a company needs. All the different sections that make up the labour market depend on the exchange of information between employers and jobseekers about wages, employment conditions, locations and levels of competition. Basically, the labour market, like any other market, is defined by supply and demand. This means that if there is a shortage of engineers in a country whose manufacturing sector attracts considerable investor attention, the engineering profession will be paid better than average and will also be offered more favourable employment conditions.
This leads us to the flexibility of the labour market, which reflects a company’s ability to make changes in the number of employees, weekly working hours, wage levels and the influence of trade unions. In a flexible labour market, companies are subject to fewer regulations and wages are determined by pure market principles, whereas a market with low flexibility is subject to minimum-wage restrictions and trade-union requirements, coupled with additional social factors.
Fundamental indicators related to the labour market
Having provided a basic outline of the labour market’s significance and characteristics, it is now time to turn our attention to the fundamental indicators that measure its health and signal changes in employment conditions. In particular, we will be following indicators reflecting changes in the US labour market, provided by the US Department of Labor.
 There are several keenly followed indicators that allow investors to assess how well the US economy is faring. These numbers are also tracked by the Federal Reserve when conducting monetary policy and have been designated as some of the main gauges for measuring the economy’s health. Some of the employment data are of the highest importance, while others have a medium level of significance. They are as follows:
– Non-farm Payrolls
– Unemployment Rate
– Average Hourly Earnings
– Average Workweek
– ADP Non-farm Employment Change
– Initial Jobless Claims
The first four indicators listed above are released in a monthly employment report by the US Department of Labor called the Employment Situation, or simply the jobs report. It is published on the first Friday of each month at 8:30 a.m. ET (13:30 GMT) and includes information for the previous month. The Non-farm Payrolls and Unemployment Rate are considered to have the greatest importance, while Average Hourly Earnings and Average Workweek have a medium impact on the markets.
Non-farm Payrolls
 Non-farm Payrolls is the most important and widely tracked piece of data released in the jobs report. The figure reflects the change in non-farm payrolls compared with the previous month. A rise in the number means that US employers created more jobs in the month than in the previous one, and vice versa. It represents the total number of US employees in any business, excluding the following four groups:
– farm employees
– general government employees
– employees of nonprofit organizations
– private household employees.
The reading usually varies between +10,000 and as much as +250,000 when the US economy is performing well. Despite the volatility and the possibility of large revisions, the Non-farm Payrolls indicator provides the most timely and comprehensive reflection of the current state of the economy. Total non-farm payrolls account for 80% of the workers who produce the entire Gross Domestic Product of the United States.
A positive change in Non-farm Payrolls, especially if it exceeds projections, provides strong support for the US dollar, pressuring its counterpart currencies. Such a sudden and sharp move can be observed in the screenshot below, which captures the release of October’s Non-farm Payrolls.
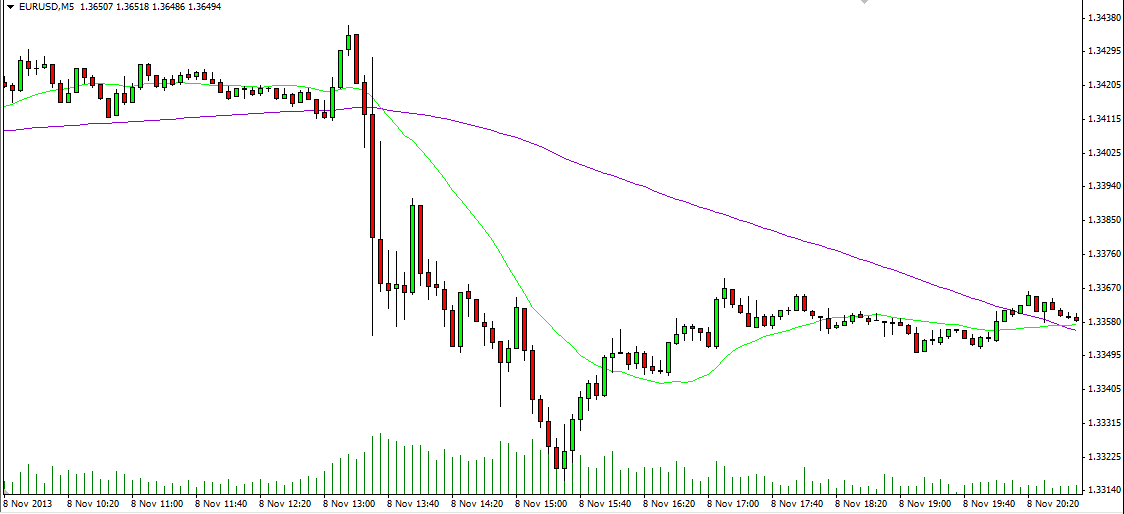 Source: MetaTrader 4 by MetaQuotes
On 8 November 2013, the US Department of Labor reported that US employers added 204,000 workers to payrolls in October, defying analysts’ expectations for a drop to 120,000 from a month earlier. Also adding to bullish sentiment, September’s reading was revised upward to 163,000 from the initially estimated 148,000. This, coupled with the unemployment rate meeting expectations and personal income outstripping projections, led the EUR/USD to decline by more than 100 pips before consolidation set in later.
Unemployment rate
 The unemployment rate is the second most keenly awaited employment indicator released in the Employment Situation report. The figure represents the percentage of the eligible workforce that is unemployed but actively seeking employment. It is calculated on a monthly basis. This indicator is of major significance and causes wide fluctuations in the financial markets.
A person who is not classified as employed or unemployed is excluded from the statistics. A person counts as unemployed if he or she meets all of the following criteria:
– was unemployed during the reference week
– is able-bodied
– has been seeking employment for a period of at least four weeks, ending in the week in which the survey is conducted. People who have been laid off and are awaiting recall are also counted as unemployed.
A higher unemployment rate is something every government tries to avoid, as it leads to a reduction in consumer spending, which makes up around 70% of the US Gross Domestic Product. Not only does a higher unemployment rate mean that more people are jobless and have no income, directly impacting consumer spending, but an unhealthy labour market also leads to a loss of consumer confidence, which affects even those in employment.
Although a high unemployment rate is devastating for economic growth, unemployment that is too low should also be avoided, as it spurs inflation and pushes wages up, potentially causing the economy to overheat. A jobless rate of around 4-6% is considered healthy. Having said that, we can conclude that inflation and unemployment have an inverse relationship, as described by the Phillips curve.

Average Workweek
 The Average Workweek, also referred to as Average Weekly Hours, measures the average number of hours worked by employees on non-farm payrolls. It is often an underrated indicator, but it is an important determinant of industrial production and personal income.
Changes in the Average Workweek elicit a moderate reaction in the financial markets.
Average Hourly Earnings
 The Average Hourly Earnings indicator measures the change in businesses’ labour expenditure on a monthly basis, excluding the agricultural sector. Coupled with Average Weekly Hours, Average Hourly Earnings provides an indication of personal income growth during the respective month and is also closely observed during periods of heightened economic activity for signs of increasing wage pressures.
Like the previous indicator, Average Hourly Earnings is also a medium-volatility gauge.
ADP Non-farm Employment Change
 The ADP Non-farm Employment Change is another high-volatility indicator, published monthly by the ADP Research Institute in close collaboration with Moody’s Analytics.
It is based on actual transaction data encompassing 400,000 business clients from the 19 main economic sectors and provides a monthly snapshot of US non-farm private-sector employment.
This indicator is calculated according to the same methods that the Bureau of Labor Statistics uses. It is published every month, two days before the official BLS employment data, and is a good predictor of the government’s non-farm payroll statistics.
As logic dictates, a rise in employment should be considered bullish for the US dollar, especially if the reading exceeds expectations.
Initial Jobless Claims
 Initial Jobless Claims reflect the number of people who filed applications for unemployment benefits for the first time during the previous week. A drop in jobless claims means that fewer people have lost their jobs in the tracked period, indicating a strengthening in the labour market, and vice versa.
This indicator triggers very strong short-term movements after its release, particularly when it exceeds or confounds analysts’ projections. The following screenshot captures exactly such an event.
 Source: MetaTrader 4 by MetaQuotes
The picture above reflects a report by the US Department of Labor on 27 November 2013, which shows that Initial Jobless Claims fell to 316,000 in the seven days to 23 November. Not only did they fall, but the reading also defied analysts’ projections for a jump to 330,000 from the preceding period’s upwardly revised 326,000.
If you take a look at the economic calendar for 27 November, you will see that the Initial Jobless Claims numbers coincided with the release of October’s Durable Goods Orders, an indicator regarded as a market mover, which came in worse than expected. However, in this case the applications for initial unemployment assistance seemed to outweigh the industrial data, as you can see from the strengthening of the US dollar.
Although Initial Jobless Claims are considered a medium-volatility indicator by some analysts, they are closely watched as they provide intra-month information about the state of the labour market. However, one week is a very short period of time, meaning that high volatility is often seen. Economists therefore use the four-week average of Initial Jobless Claims to smooth week-to-week volatility.
Another measure of the labour market is the so-called Continuing Jobless Claims, which, however, is an indicator of lower volatility and does not have such an impact on the market. Continuing Jobless Claims reflect the number of unemployed people who qualify for benefits under unemployment insurance and have already been receiving unemployment assistance for a while.