Retracements
This lesson will cover the following
- A definition of a retracement
- What information can they provide?
- Can they be measured using exact percentages?
As we have already said, a trend seldom follows a straight line; it is usually punctuated by a series of smaller trends. These smaller countertrends are known as retracements.
Definition
 A retracement is a temporary reversal in price that moves against the major trend. It is also called a correction to the principal trend. Retracements and reversals should be distinguished. Retracements are usually short-term movements within the longer-term trend, whereas reversals signal the end of the larger trend and the beginning of a new one.
During a significant uptrend, the rise in prices is periodically interrupted by downward corrections. The start of these corrections is usually a resistance point, while the bottom is typically a support point. A retracement is a smaller trend in its own right and runs in the opposite direction to the major trend.
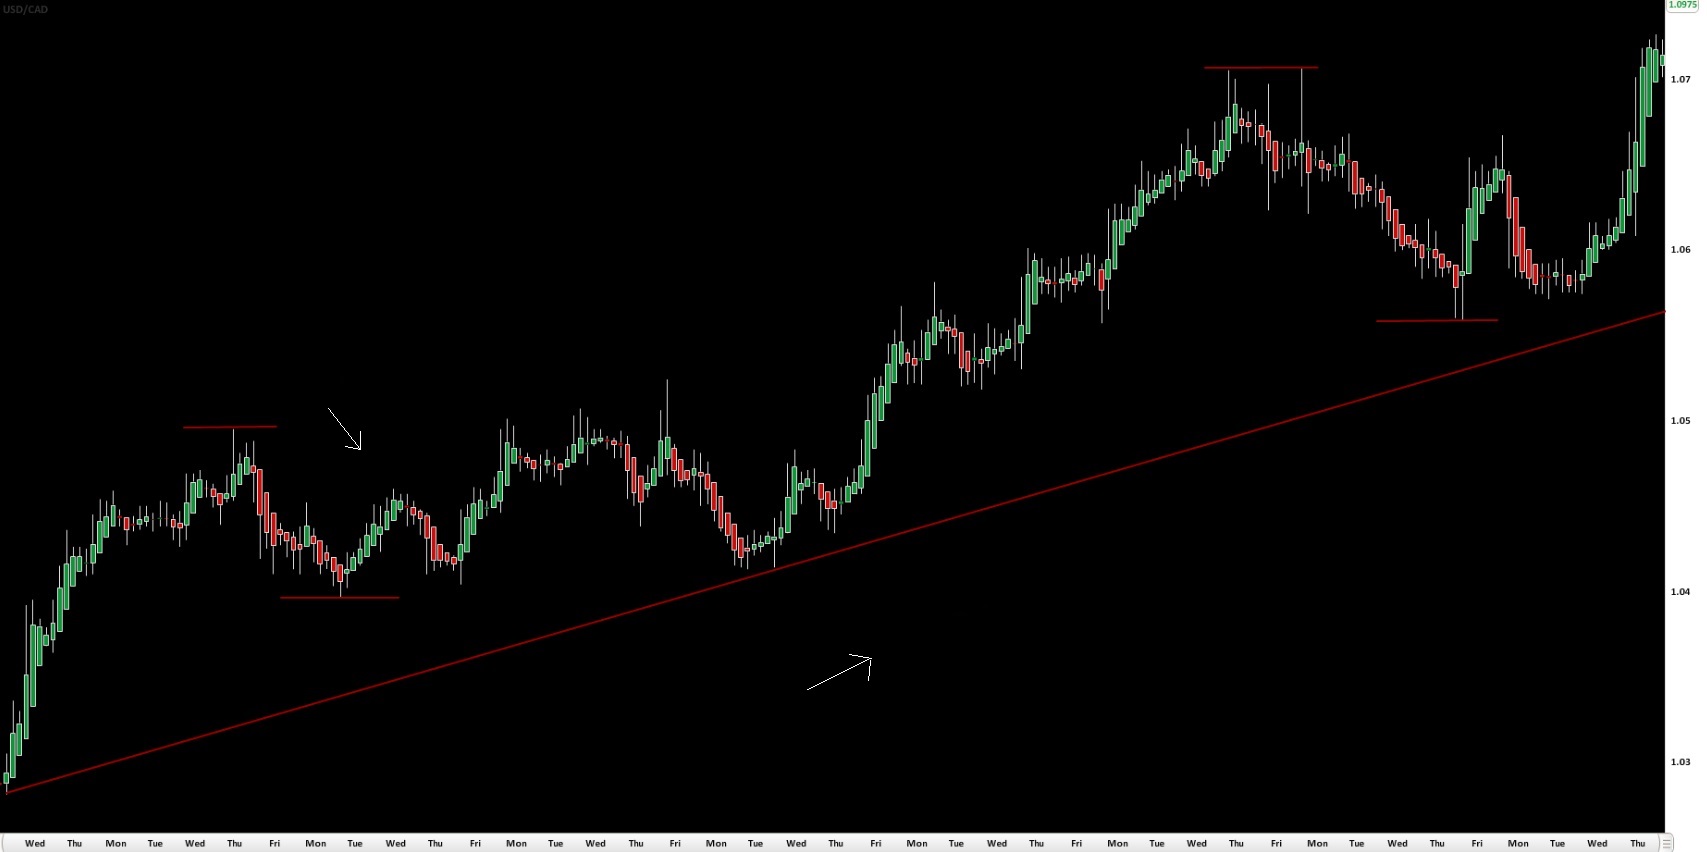
On the 4-hour chart of USD/CAD above, we can see a major uptrend with a number of small countertrends.
- Trade Forex
- Trade Crypto
- Trade Stocks
- Regulation: NFA
- Leverage: Day Margin
- Min Deposit: $100
Retracements can be very informative
 Within a trend, many retracements of different magnitudes and time periods can occur. As the end of a correction is marked by a support or resistance point (depending on the trend direction) for the longer-term trend, the length and duration of the correction can tell us something about the strength of that longer trend.
In a sharp uptrend we can expect retracements to be brief and to retrace only a small percentage of the prior climb. A general rule is that if a trend appears to be rising strongly, retracements may be less than 50% of the previous advance. The same applies to downtrends.
If a retracement in an uptrend extends its decline to more than 50%, the trend line of the longer uptrend becomes irrelevant. Therefore, the extent of a retracement provides an indication of the strength of the larger trend.
A retracement within an existing trend can provide a trader who missed the earlier stages with an opportunity to ride the longer trend. If the retracement continues to hold above the longer-term trend line and does not exceed a 50% pullback, it may present an opportunity to trade in the direction of the longer-term trend.
Exact percentage?
 In reality, retracements rarely reach a specific percentage. There are analysts, however, who believe that retracements measured in percentages can provide a good point to enter into a trade. In an uptrend or downtrend, prices tend to retrace by a specific percentage. The most frequently quoted figures are 33 1/3%, 50%, 66 2/3% and the well-known Fibonacci levels of 38.2% and 61.8%. We shall discuss the so-called Fibonacci retracements at a later time.