Commodity Channel Index
This lesson will cover the following
- What is Commodity Channel Index?
- How can it be used in order to trade?
- How can we change the settings of the CCI?
Explanation
 The Commodity Channel Index (CCI) has been developed by Donald Lambert, who described it in the October 1980 issue of Commodities magazine. As an indicator it can be used in any market. It is an indicator, that belongs to the group of the so called oscillators, which measures the deviations of an instruments price from a moving average. The CCI is usually relatively high, in case prices exceed significantly their average value, and conversely, it is relatively low, in case prices tend to remain far below their average value. The CCI can be used, so that a trader can identify overbought and oversold levels.
The Commodity Channel Index may facilitate the identification of peaks and troughs in the price of a tradable instrument and also indicate the exhaustion or end of a trend and a possible change in its direction.
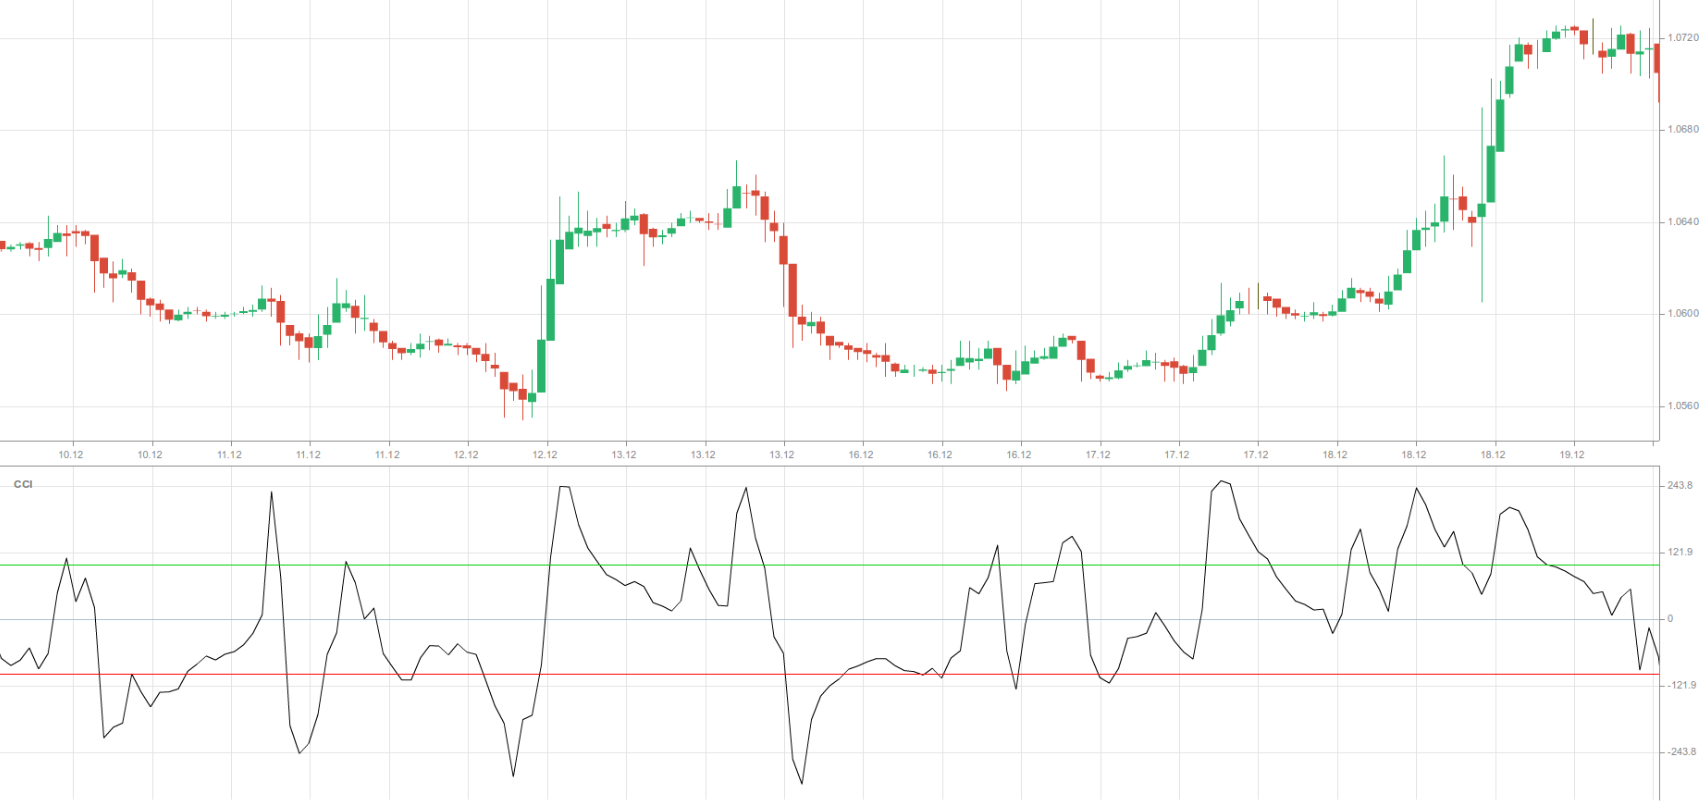
Here we can see how the CCI is visualized on the 1-hour chart of USD/CAD (the black line, oscillating between the two extreme levels).
The CCI provides a slightly different picture than the stochastic indicator, while, in some cases, the signals it produces are more reliable. The difference between the CCI and the stochastic is minimal, so if a trader uses both indicators it would likely be a duplication of effort. What is more, using both indicators would likely create false confidence.
How can it be used in trading?
 The CCI can be used either as a leading or as a coincident indicator. What is specific about it is the fact, that it is not necessarily a bounded indicator. The CCI can rise above +100 and fall below -100. As a coincident indicator, in case it exceeds the +100 level, this usually means strong price action and the possible beginning of an uptrend. In case the CCI plummets below -100, this usually means weak price action and the possible beginning of a downtrend.
As a leading indicator, the CCI can be used to identify overbought and oversold conditions.
In addition, bullish and bearish divergences can be used in order to detect early changes in momentum and possible trend reversals.
Identification of a new trend
 In most cases, the CCI moves between the -100 and +100 levels. Every move, which exceeds this range, signals unusual strength or unusual weakness, thus, it is possible an extended move to occur. We can say, that the CCI supports bullish sentiment, when it shows a positive value, and bearish sentiment, when it shows a negative value. However, if a trader uses a single zero line and expects crossovers of this line, this could lead to whipsaws. But if he/she waits for a move above the +100 level (and enter a long position), or a move below the -100 level (and enter a short position), the probability of whipsaws occurring diminishes.
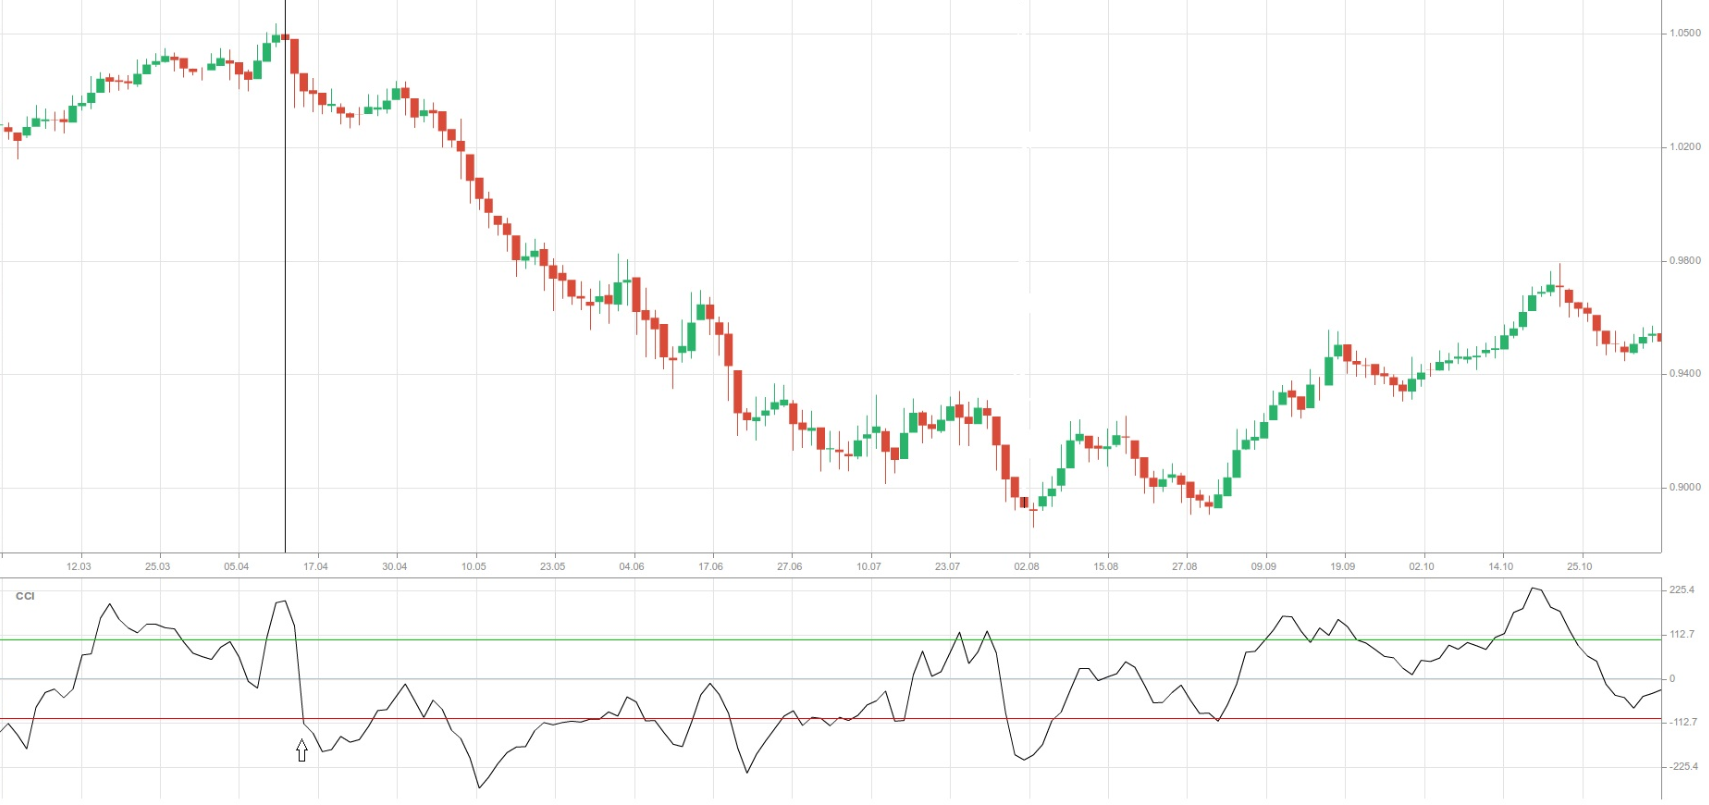
Here we can see a 1-day chart of AUD/USD with CCI (20), overbought level (+100) and oversold level (-100). On April 12th AUD/USD reached a peak and turned down. The CCI moved below -100 on April 15th to indicate the start of an extended downward move.
Overbought and oversold
 As we mentioned earlier, the CCI is unbounded indicator, theoretically there are no up or down limits. This circumstance makes the overbought and oversold estimation a subjective matter.
In a trading range (flat trend) a range of -100/+100 usually can be applied in order to fit the concept of overbought and oversold conditions. However, in other situations (strongly trending markets), traders may need to apply more extreme levels. For example, a -200 level for oversold and a +200 level for overbought. Such levels are considerably harder to reach and represent in a better way extreme conditions.
A reading of the CCI above the +200 level means that the tradable instrument has been overbought, which implies that the price may begin to fall. In this case, a trader will look to enter into a short position, with the entry being set when the CCI crosses +200 back to the downside.
A reading of the CCI below the -200 level means that the tradable instrument has been oversold, which implies that the price may begin to rise. In this case, a trader will look to enter into a long position, with the entry being set when the CCI crosses -200 back to the upside.
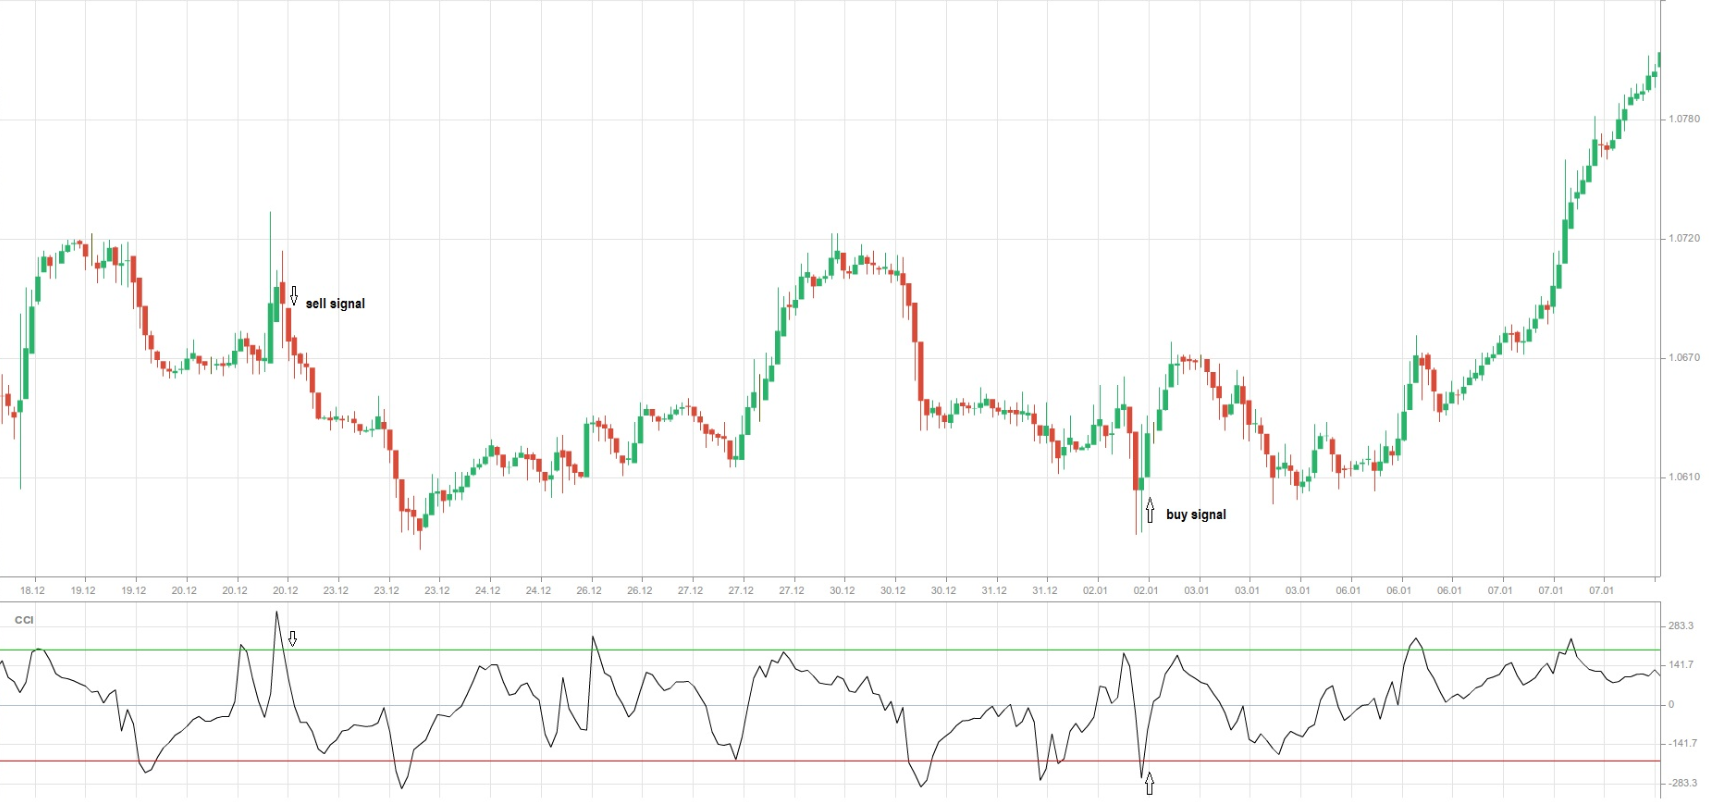
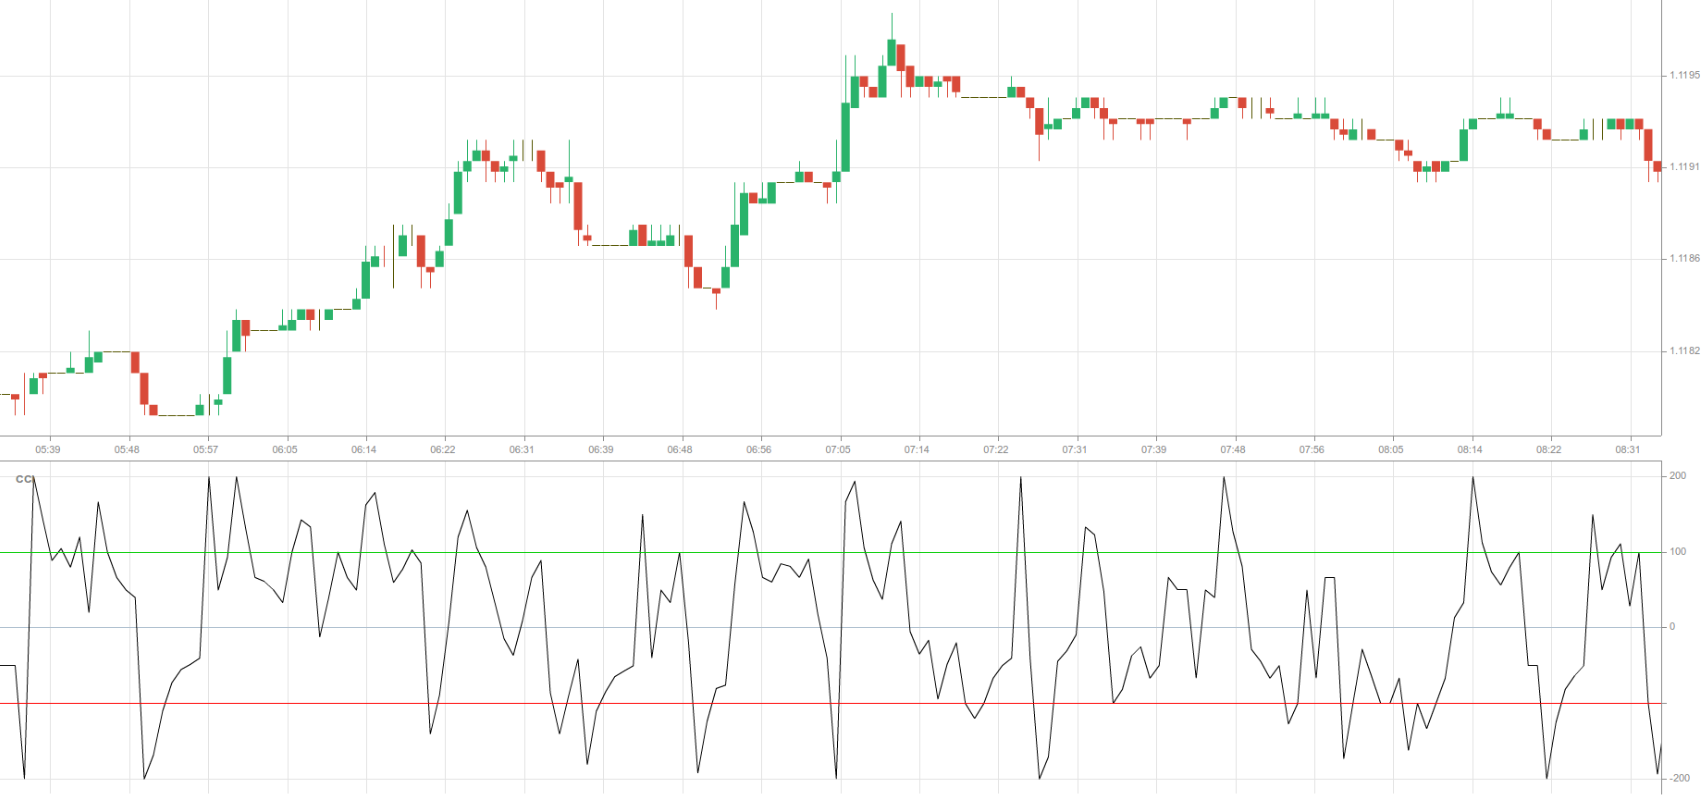
Here we can see a 1-hour chart of USD/CAD with CCI (14), overbought level (+200) and oversold level (-200). On December 20th after crossing the overbought level, the CCI moved back below it, signaling a sell entry. On January 2nd after crossing the oversold level, the CCI moved back above it, signaling a buy entry. It is crucial to wait for these crosses in order to reduce whipsaws.
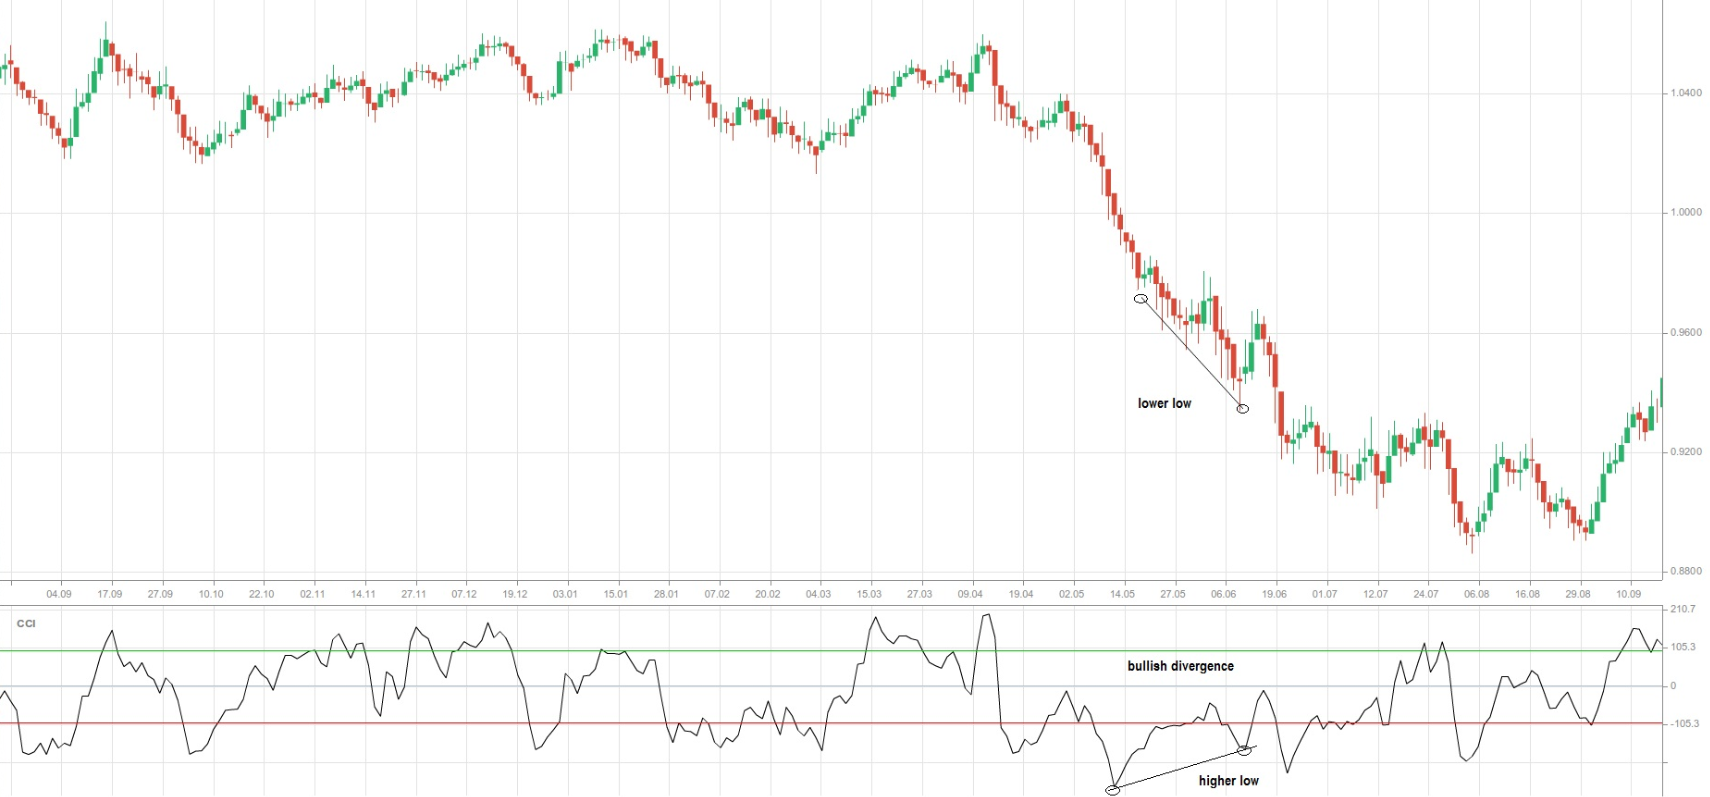
Bullish and bearish divergences
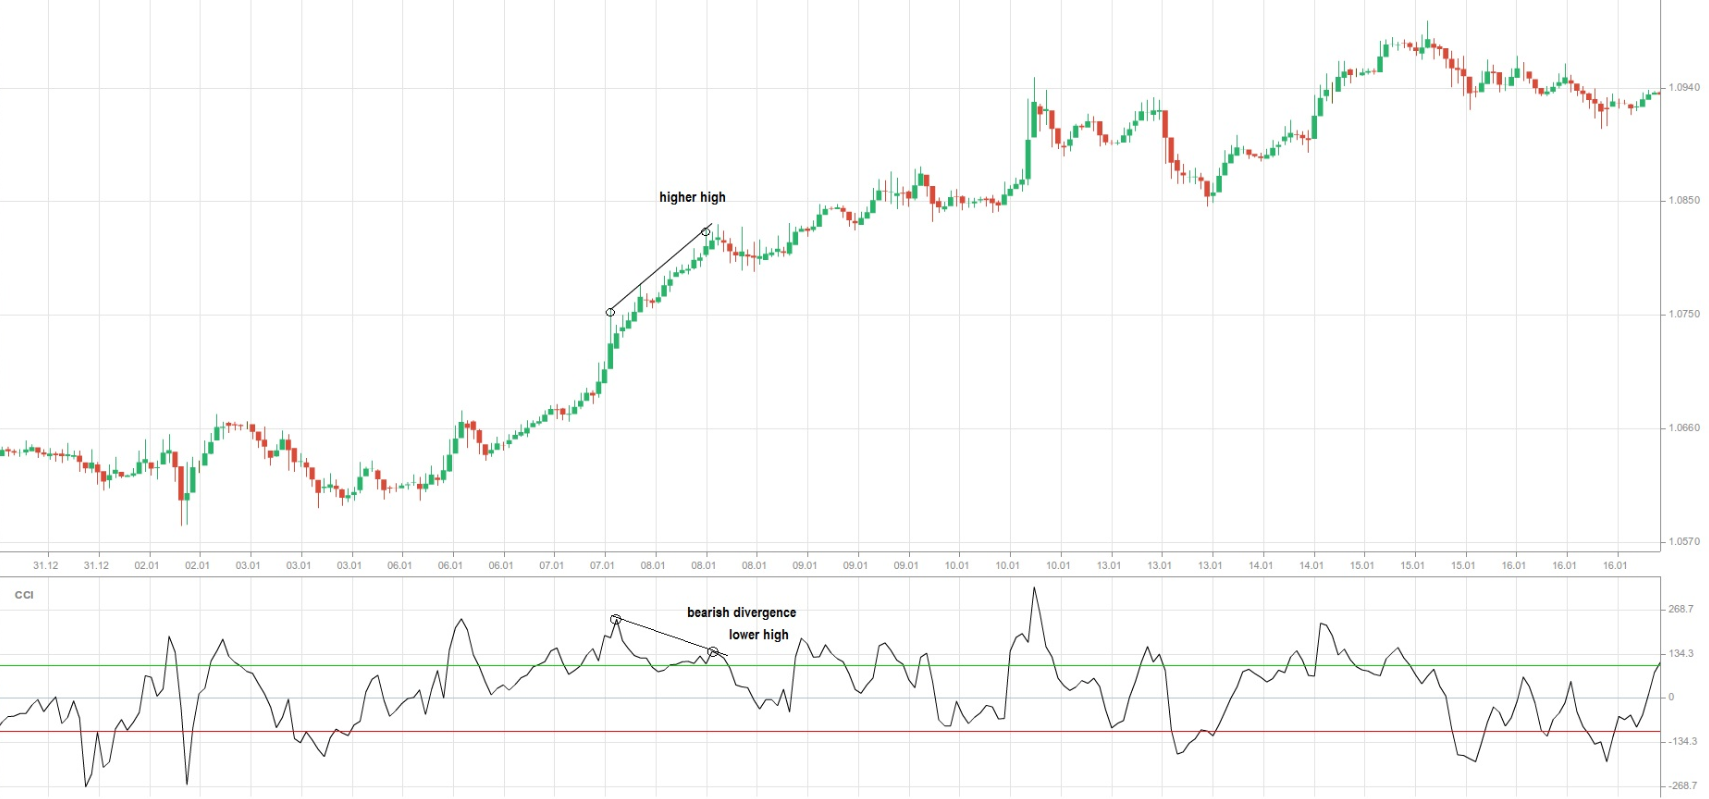
 Usually divergences indicate a potential reversal level, as momentum fails to confirm price. A bullish divergence can be observed, when the price of the tradable instrument makes a lower low and the CCI makes a higher low, which implies downside momentum is weak. A bearish divergence can be observed, when the price of the tradable instrument registers a higher high and the CCI makes a lower high, which implies upside momentum is weak.
However, as reversal indicators, divergences can provide false signals during a strong trend. A resilient uptrend can often produce a number of bearish divergences before a peak is actually seen. A strong downtrend can often produce a number of bullish divergences before a bottom actually occurs.
As divergences reflect a shift in momentum, which can signal a trend reversal, technical analysts need to establish a confirmation level for the CCI. A bearish divergence could be confirmed with the CCI breaking below the zero line, or a breach of the support level on the price chart. A bullish divergence could be confirmed with the CCI breaking above the zero line, or a breach of the resistance level on the price chart.
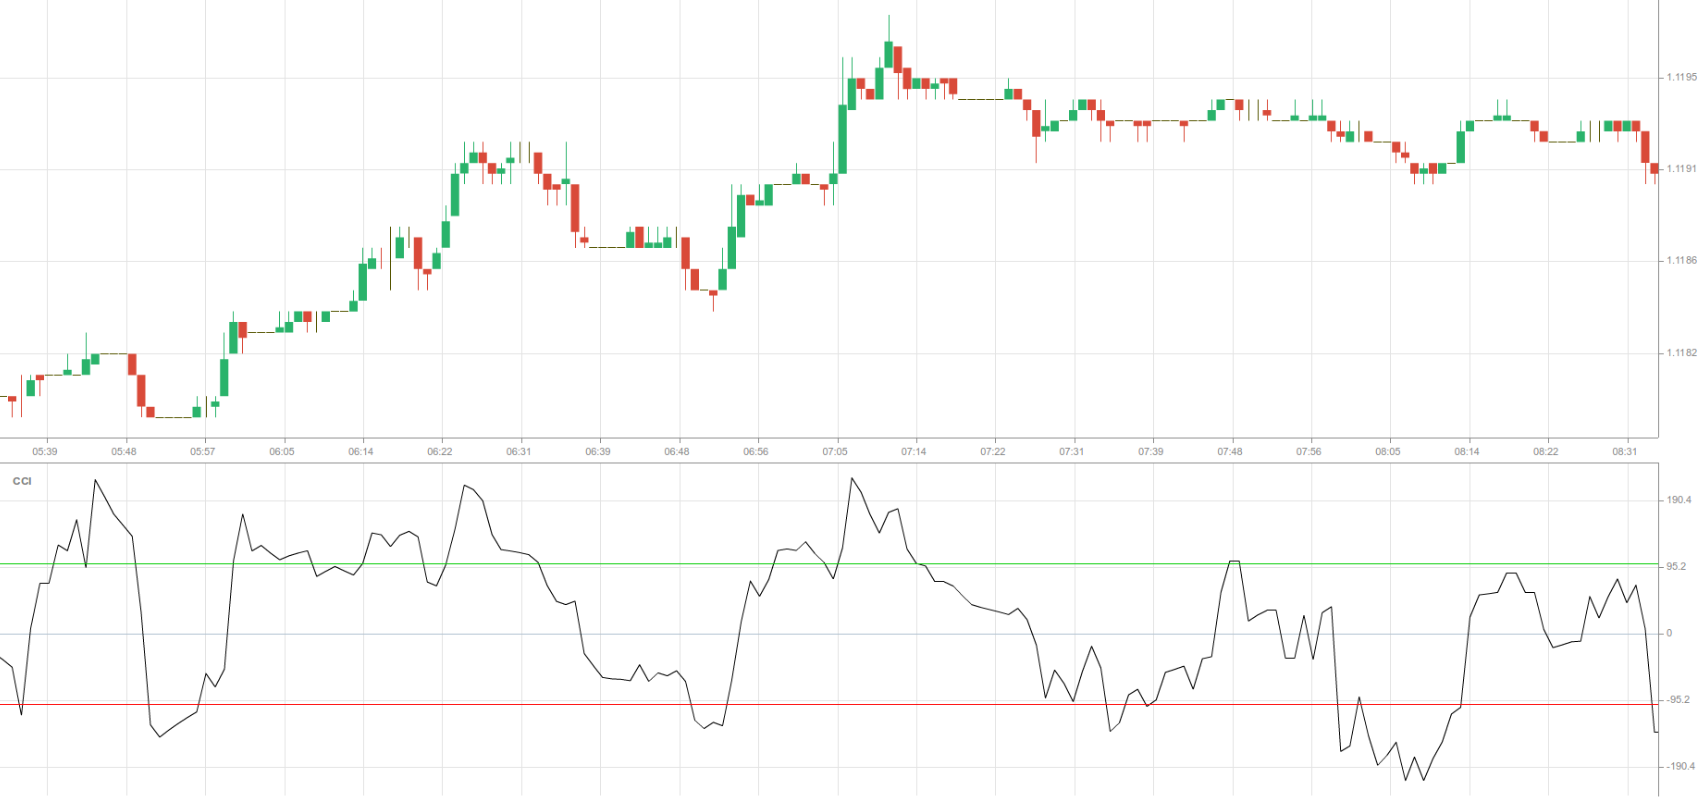
Here we are looking at 1-hour chart of USD/CAD with CCI (14).
Here we are looking at 1-day chart of AUD/USD with CCI (20).
Changing the settings of the CCI
 The CCI is usually set to 14, which means that the indicator will show the recent price changes compared to average price changes during 14 periods of time (depending on the time frame currently used). This setting can be increased or decreased in accordance with a traders preferences.
When the CCI is set to less than 14, this shows a more reactive average line, which oscillates in the range (-100; +100, for example) more frequently, while not remaining in either of the extremes for too long. When the CCI is set to more than 14, this shows a less reactive average line, which touches or exceeds the extreme levels less frequently. If it reaches the extremes, it tends to remain there for a longer period. Now, let us look at two different settings of the CCI, a low-value and a high-value.
Here we use CCI setting less than 14, 6. We can see how many times the average line (black line) moves above and below the +100 and -100 levels and does not remain there for too long.
Here we use CCI setting more than 14, 26. We can see how the average line (black line) moves beyond the extreme levels only a few times and how it tends to remain at or outside these levels for a longer period.