Parabolic SAR
This lesson will cover the following
- e
- What is the Parabolic SAR
- What does it tell us
- How is it calculated
- What to combine it with
- What signals does it generate
The Parabolic Stop and Reverse (SAR) is a trend following indicator, which is used to effectively identify price reversals. Being able to properly utilize the SAR allows a trader to determine the direction of the trend, spot suitable entry and exit points and assist in placing trailing stops.
It is visualized by a series of dots or dashes, which are placed either beneath or above the price action, depending on the market trend. As the two cross, a signal is generated that the current trend is most likely coming to an end, thus giving us a hint to close any open positions.
The series of dots, which visualize the SAR, are at a certain distance below the price action, when the market is trending upward. Logically, during a downtrend, the parabolic SAR stands above the price action, again at a certain distance.
The Parabolic SAR has two parameters, which can be fine tuned according to traders preferences. These are the step value (how much will the SAR increase when a new extreme occurs), and the maximum value of the indicator. We will discuss these later in the article.
Each trend has an end
 As we know, each trend is bound to end at some point. As the price movement begins to draw closer to a reversal, the parabolic SAR will reduce its distance to the price action. The smaller the gap between the two is, the closer the moment of a possible price reversal is and a penetration becomes more likely.
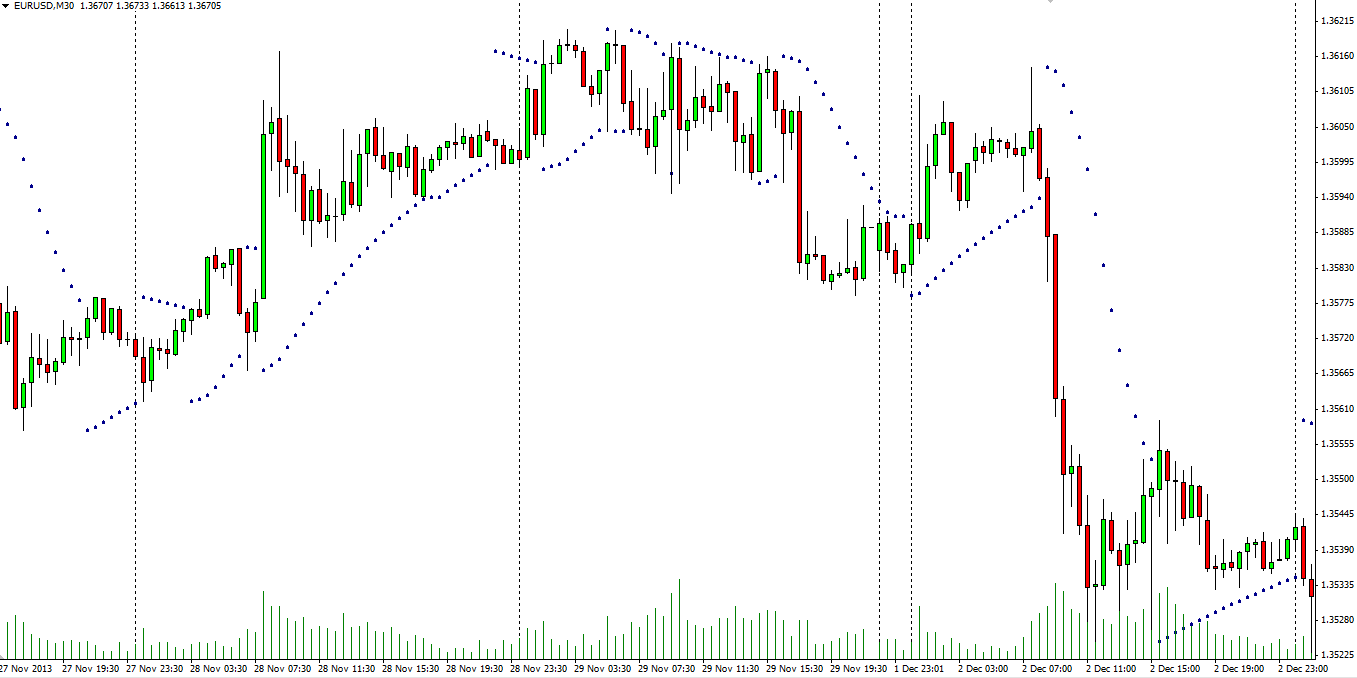
At that point, the dots visualizing the SAR will begin forming on the other side of the price movement, thus signaling that a reversal is occurring. This would be a fine moment to consider closing our long position after youve awaited a confirmation. The following screenshot presents an uptrend, which comes to an end and collides with the dots beneath it.
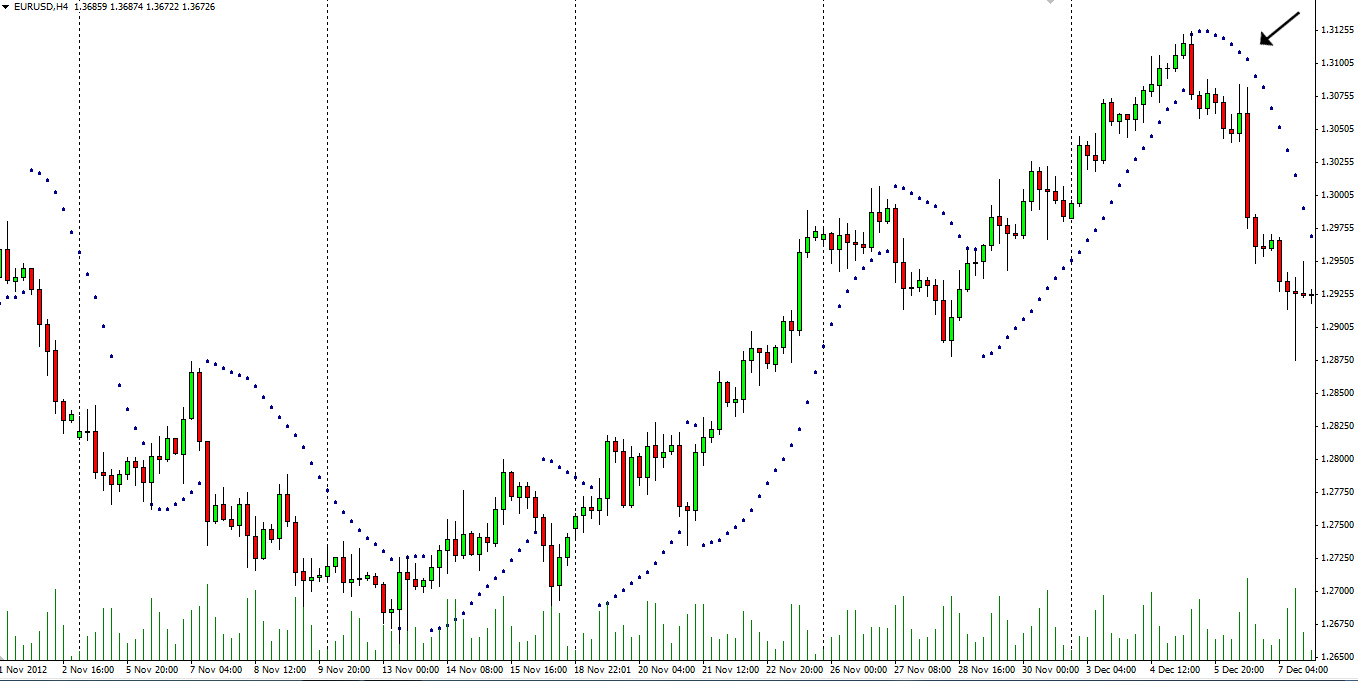
Naturally, the opposite scenario is also true. When the market trends downwards, the SAR is plotted above the price action and as soon as the trend begins to lose momentum, the distance to the indicator gets narrowed and an eventual penetration is likely. This is illustrated below.
Apart from identifying trend reversals and therefore entry and exit points, the parabolic SAR is also helpful for adjusting your trailing stop-loss. The indicator can be used to move the stop loss as each new dot forms, which means that an unexpected price reversal will cause you almost no harm, stopping you out in profit.
How is the parabolic SAR calculated
 The SAR is calculated according to the following formula:
SARtomorrow = SARtoday + AF x (EPtrade-SARtoday)
AFs default value is 0.020 and its increased by 0.02 for each bar where a new high/low is made, depending on the trend direction, until the value of 0.20 is reached. Extreme Price (EP) is the extreme high price for the trade, if it was long or the extreme low price for the trade, if it was short.
In need of assistance
 The trending nature of the Parabolic SAR makes it a very successful tool on trending markets with long swings. The results however are far less satisfactory when the asset is trading sideways as the short swings which the price is forming do not give us enough time to wait for confirmation of a price reversal, thus making it extremely risky to enter a position based on a hunch only.
Traders most often combine the SAR with other indicators to get better performance out of it. Since the Parabolic SARs main purpose is to define the trend direction and detect any changes in it, it would be wise to combine it with a strength-determining indicator, such as the Average Directional Movement Index (ADX).
You should avoid pairing the SAR with another trend-defining indicator as this would only give you two sets of trend confirmation signals. If however you use a tool to gauge the strength of the trend, and on that basis reach a conclusion that it is strong enough, you can then use the parabolic SAR to search for optimal entry and exit points in your trading session.
On the screenshot below you can see illustrated the combination of SAR and ADX.
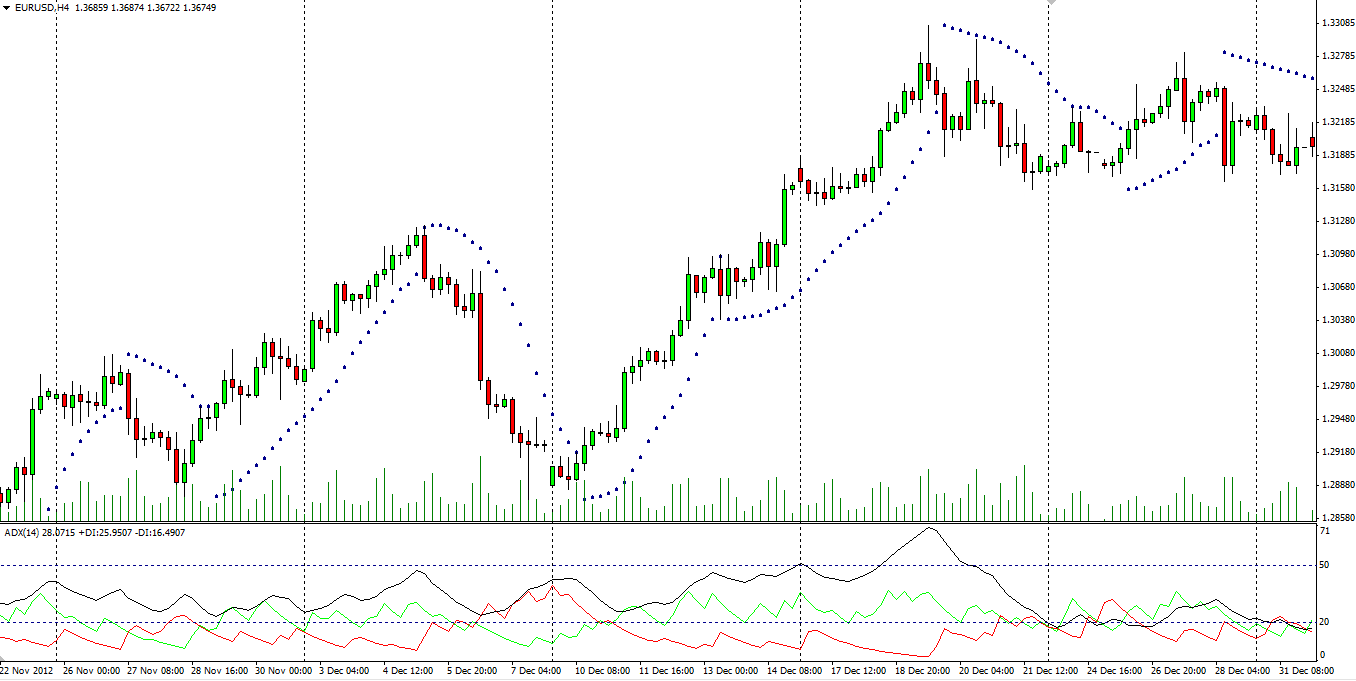
We mentioned in the previous article “Average Directional Movement Index” that by default, the minimum ADX level for entry points should be 25, as suggested by the inventor of the indicator, J. Welles Wilder. However, many traders prefer to use the level of 20, as it generates more buy/sell signals. This is generally up to each market players unique trading system. For our purposes we will use the 20 level.
When exactly to enter
 After the market has turned trending and our ADX line accelerates past the level of 20, signaling the trend is accelerating, you can now prepare to enter a position. But on which SAR dot should one enter a position, you might ask.
Well, there is no general rule for that and like with almost everything else in Forex, it depends on ones unique trading system and personal preferences. It is however common that traders wait for around 2 – 4 opposite dots to form before committing to ride the newly formed trend. On the screenshot below, weve used three dots of opposite direction as a confirmation of the price reversal. As usual, this system is not 100% bullet-proof, but it does yield satisfactory results. Here is an example.
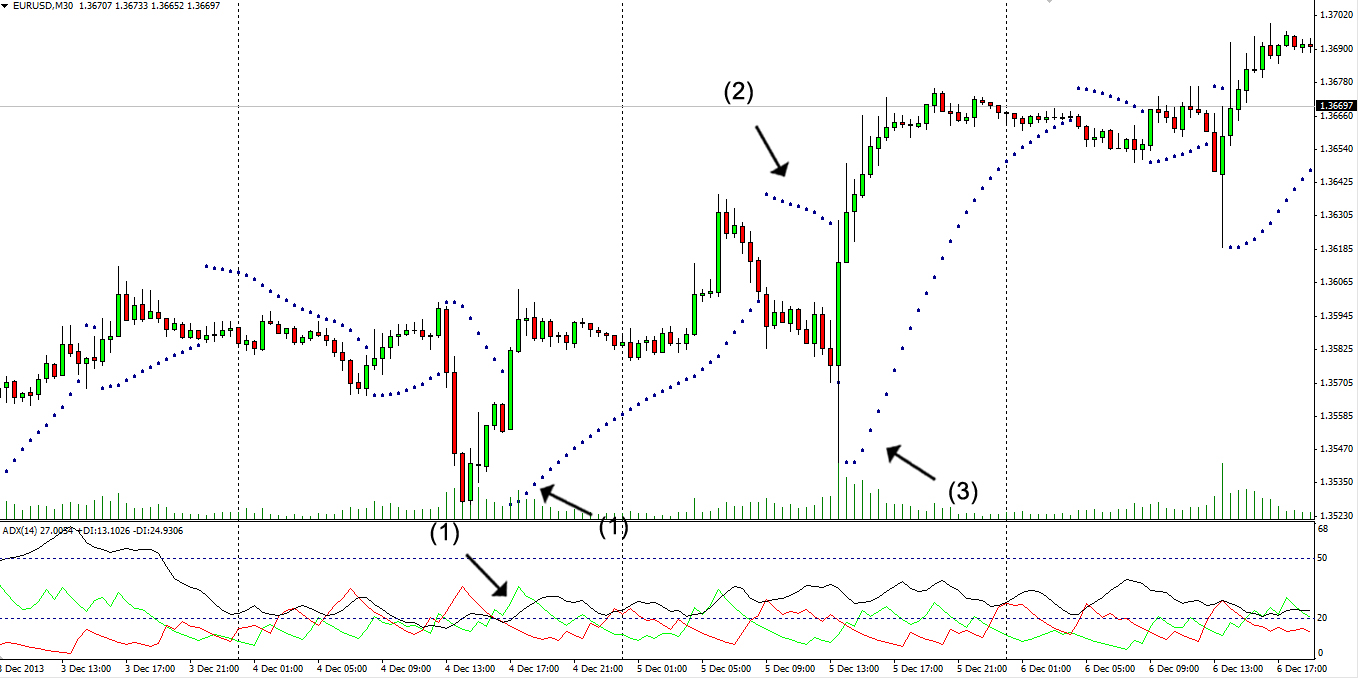
As you can see on the screenshot above, the ADX begins to accelerate past the 20-level at (1), shortly after it rebounded from a low. This makes the current market conditions optimal and relatively safe to base our trading decisions on the parabolic SAR. Dont forget to use a trailing stop to diminish the negative effect of a sudden price reversal. As the upward movement develops, a correction forms at (2) and according to our strategy to exit a position after 3 opposite dots have formed, we close our trade. After that however, we enter a new long position at (3) after three new opposite dots have been plotted and as the ADX continues to hold well above the level of 20.
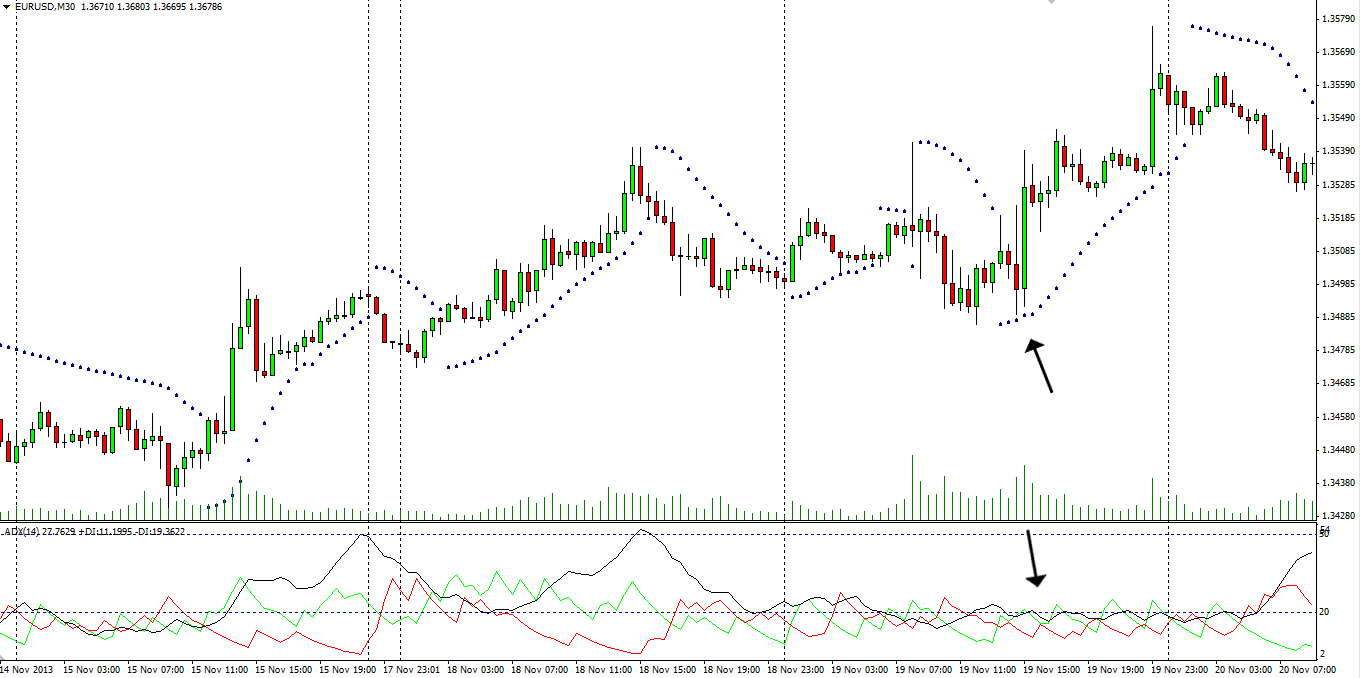
The reverse scenario is pictured below. You can see that the ADX is holding below our entry level since the market is trading sideways. This is a clear sign that you must refrain from establishing your trading decisions on the SAR, although it currently provides a buy signal.
Adjusting the SAR settings
 We mentioned earlier in the article that the Parabolic SAR has two settings which you can fine tune to achieve best coherence with your unique trading system – the step value and the maximum value.
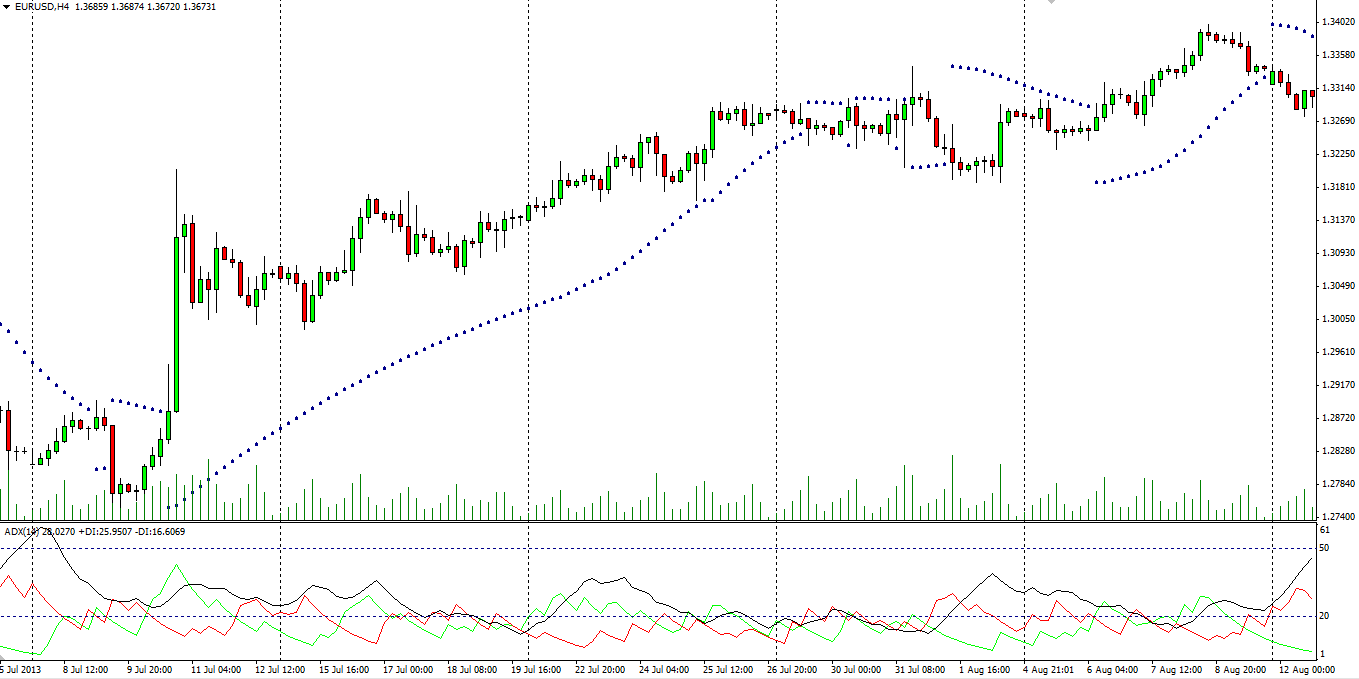
The step value determines how sensitive the Parabolic SAR is to changes in the price action. The lower the setting is, the less sensitive the indicator is, while a higher setting will allow it to spot trend changes early.
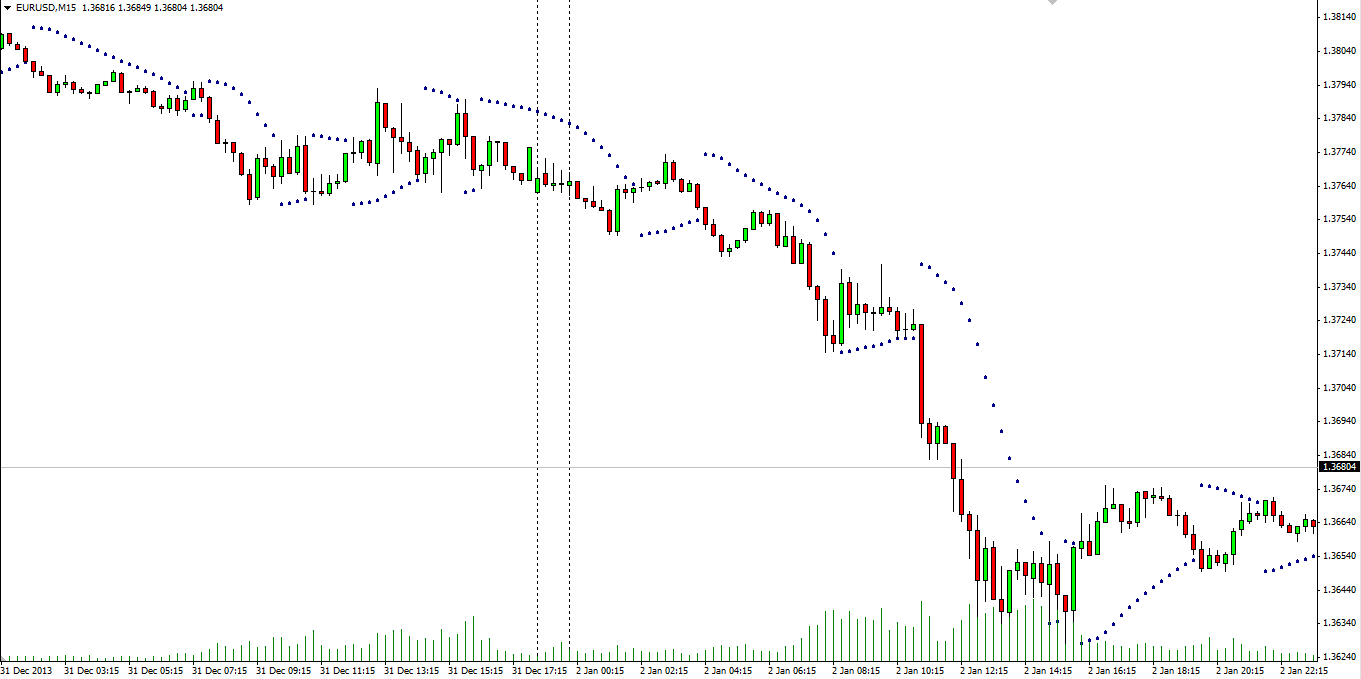
Each of the extremes however has its negative aspects as well. If you use a less sensitive step, the SAR will generate more reliable signals, which however will be lagging behind, forcing you to sometimes enter a position near the end of the price movement. On the screenshot below you can see how the minimum step affects the indicator.
On the other hand, a maxed out step value will produce many more on-time signals as it tracks closely the price action, but many of them will point to false trends and therefore result in losses. The following screenshot reflects the same moment of the trade, but with the step value switched to 0.08.
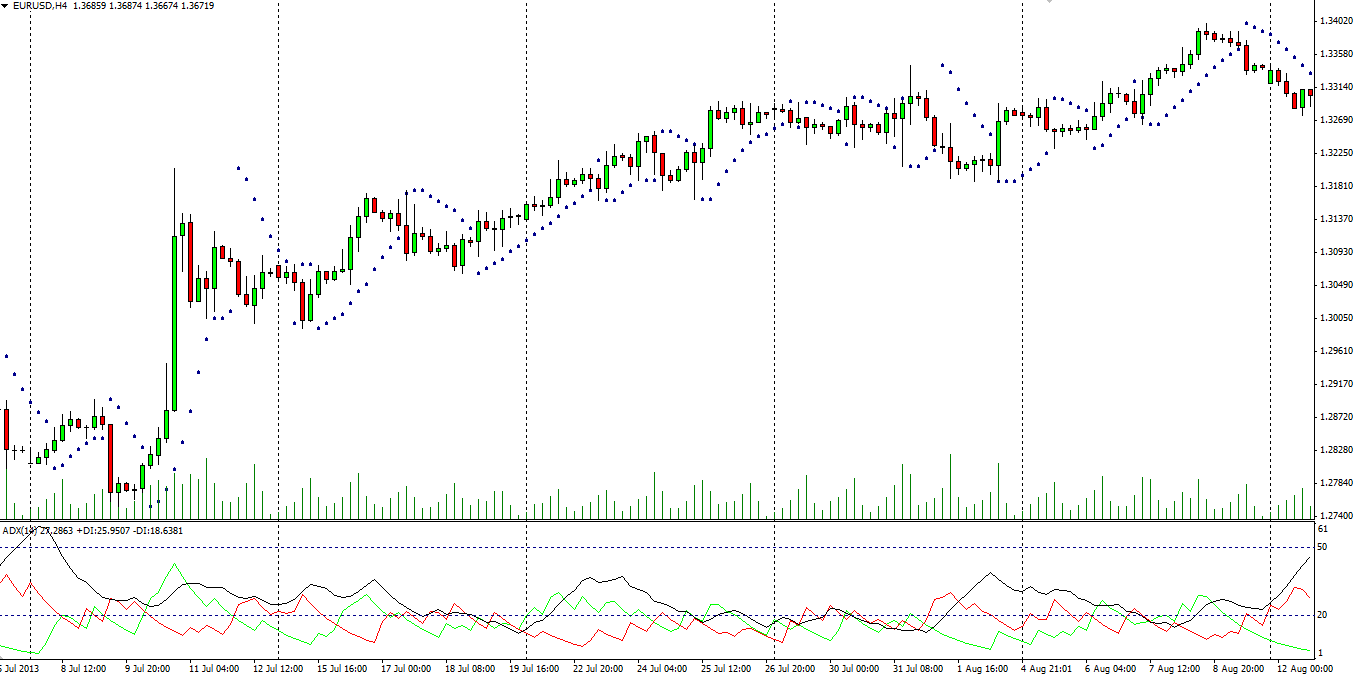
When you compare both, you will notice that they are not exactly optimal. Therefore, a more balanced setting should be chosen. Each trader should decide what value to use based on detailed testing. It is advisable to try it out on default settings and then conduct additional tests with manual ones.
Maximum value
 The second parameter you can adjust is the maximum value of the Parabolic SAR. Unlike the step value however, it has very little impact on the way the indicator behaves. It basically limits the SARs adjustment at price extremes, and ranges between 0.2 and 0.8. What it does is limit the effect of the “step value” setting, instead of changing the SAR itself. It prevents the “step value” from rising exponentially during an extreme trend which could skew the reading.