Flags and Pennants Price Patterns
This lesson will cover the following
- How is a flag formed?
- How is a pennant formed?
- How to trade these patterns?
These are short-term continuation patterns that can be observed frequently. They may resemble wedges, rectangles and triangles, but they are significantly smaller and usually have a less precise shape.
As both formations indicate a period of consolidation, they suggest that the preceding trend is strong. The majority of market participants continue to hold their positions, and exits are rare, which encourages more traders to join the prevailing trend.
After a breakout in either direction, price action usually accelerates immediately, with few pullbacks or throwbacks. Many traders favour flags and pennants precisely for this reason.
Flags
 Flags represent short channels whose slope is opposite to that of the preceding trend. Occasionally the slope may align with the trend itself, which implies that the trend could be even stronger.
Volume usually decreases during the formation of a flag. These patterns form over a short period – from several days to several weeks – and are usually preceded by a very steep price movement.

This is what a bullish flag looks like.
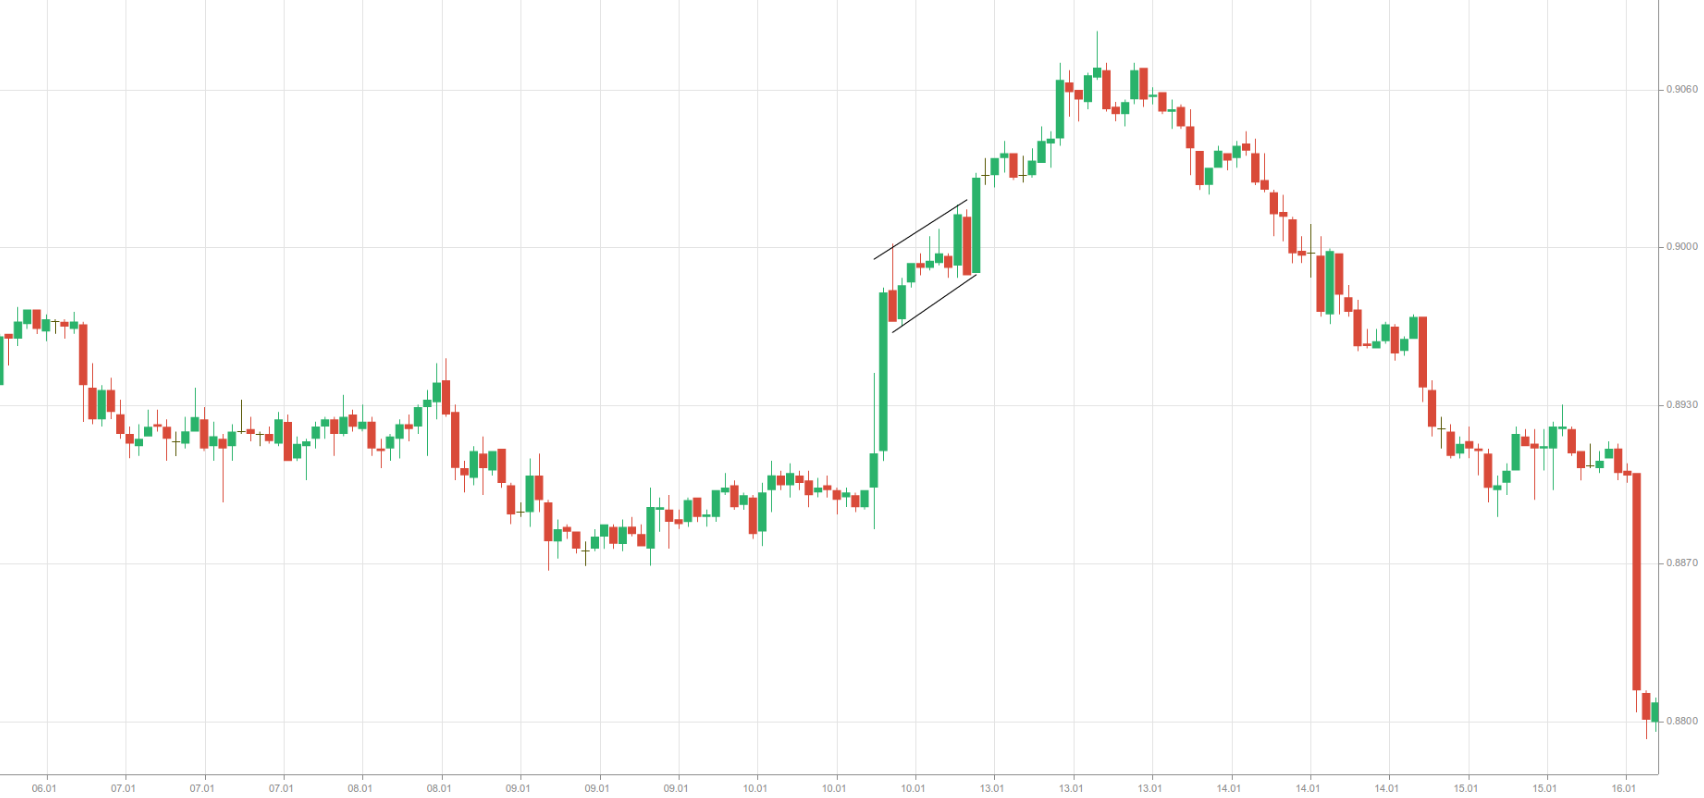
The 1-hour chart of AUD/USD above shows another flag.
- Trade Forex
- Trade Crypto
- Trade Stocks
- Regulation: NFA
- Leverage: Day Margin
- Min Deposit: $100
Pennants
 Pennants are very similar to flags. The difference is that the trend lines of a pennant eventually converge, forming a small triangle, whereas the trend lines of a flag are usually parallel. The slope of a pennant is generally opposite to that of the preceding trend, although the formation can sometimes be horizontal or slope in the same direction as the major trend.
Pennants differ from wedges because they form over a shorter period and are preceded by a sharp price movement. As the pennant develops, volume usually decreases, but it expands again on the breakout that follows the pattern.

This is what a bullish pennant looks like.
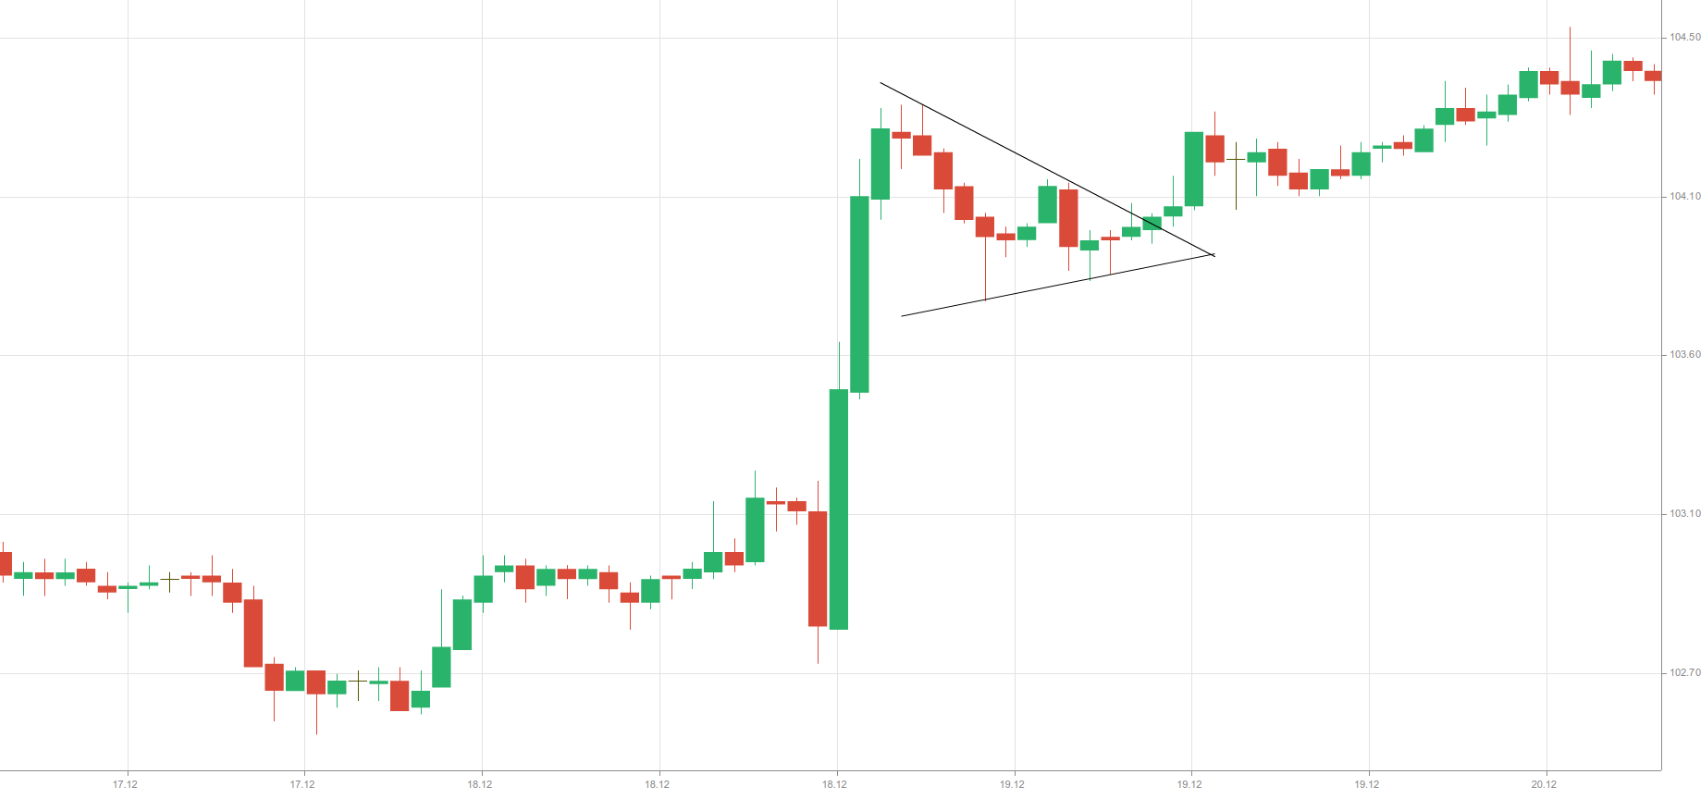
The 1-hour chart of USD/JPY above illustrates another bullish pennant.
Trading these patterns
 Flags and pennants are popular trading patterns. A crucial feature to look for when identifying them is a sharp, steep trend that precedes the formation. Traders usually refrain from acting until the pattern is complete; they wait for the breakout, which occurs once a trend line is breached and is typically in the same direction as the prior trend.
In an uptrend, the profit target is measured by taking the distance from the beginning of the steep advance to the first reversal point within the pattern and projecting that distance from the point where an upside breakout occurs. A long position should be opened when price action penetrates the upper trend line (resistance), and a stop-loss should be placed just below the lower trend line (support).
In a downtrend, the profit target is calculated by measuring the distance from the start of the steep decline to the first reversal point within the pattern and projecting that distance from the point where a downside breakout occurs. A short position should be opened when price action penetrates the lower trend line (support), and a stop-loss should be placed just above the upper trend line (resistance).
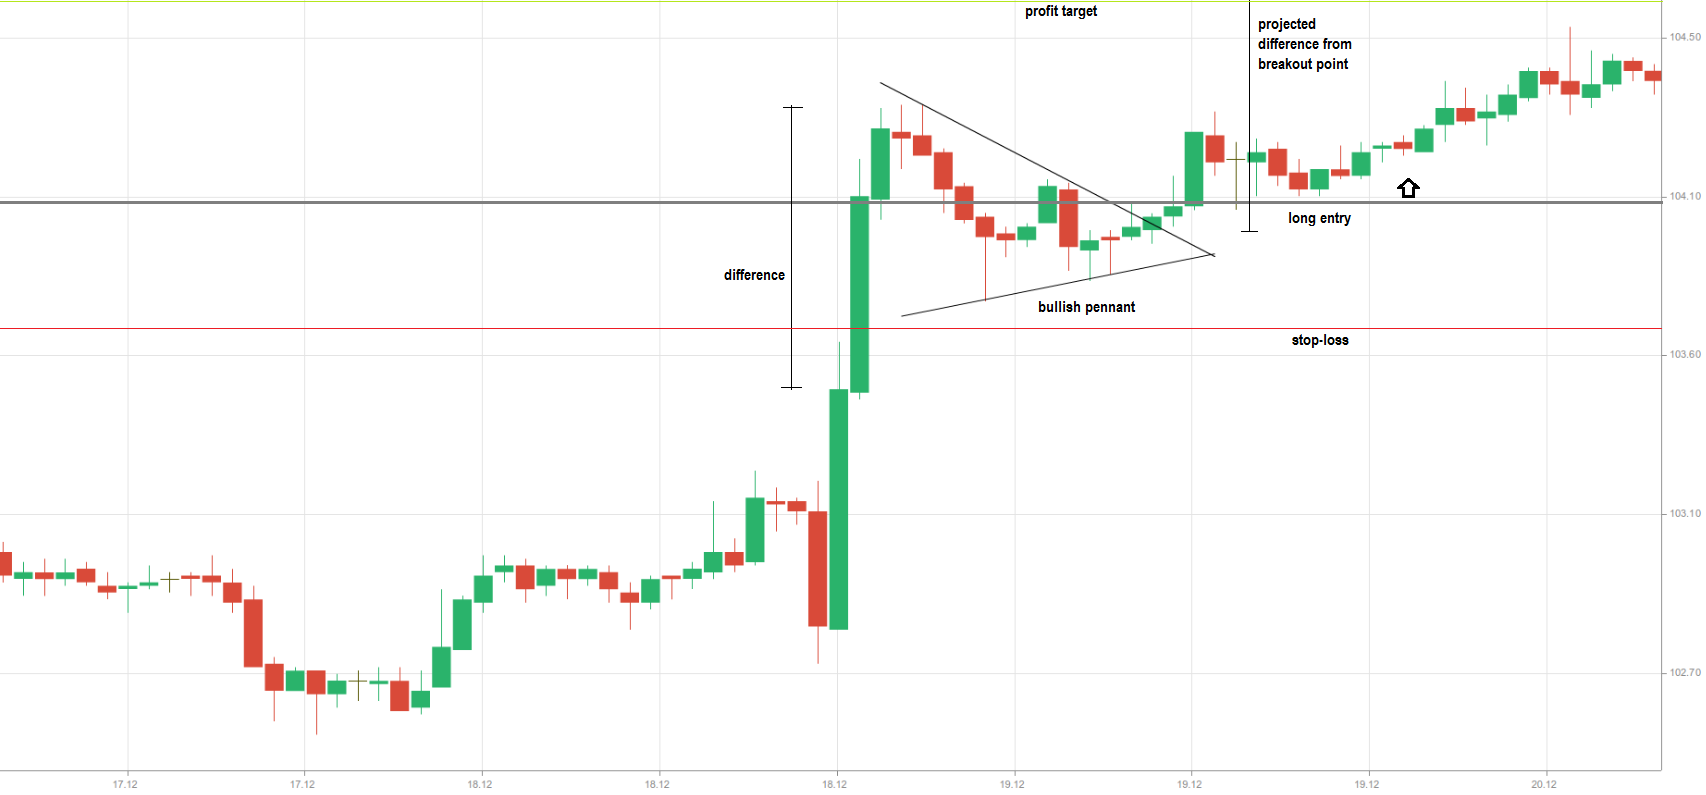
The following example demonstrates how to trade a bullish pennant. The 1-hour chart of USD/JPY above shows the locations of the protective stop and the profit target for a long position. In this case it is advisable to wait for the candle that breaches the upper boundary to close above it. The long entry can then be made as the next candle begins to form. For additional confirmation that the breakout is genuine, a trader may wait for a second candle to close above the upper boundary and enter on the subsequent candle, as in the example above.