Price action from trading ranges to strong trends. Trend candles in and out of a trend
This lesson will cover the following
- General discussion of market movement
- Trend candles and dojis
- How should a trend candle look like
- What is a climax
- Buying and selling pressure
Markets rarely exhibit simple straightforward behavior, and if they do, its just for a short amount of time. Almost always when you take a look at a chart, you will see periods when the price is moving diagonally up or down, followed by sideways, and sometimes even horizontal movement. The spectrum of price fluctuation includes situations when each tick is higher or lower than the previous one, as well as times when each movement up is immediately offset by an equal drop in the next candle.
Rarely you will see the market acting solely in one of those two ways and for a limited period of time. Instead, almost always it will trend, even if it is for longer, but at some point prices will consolidate in a distinct range for certain time.
 When you think of trends and trading ranges, you need to understand them as a part of the bigger picture. Each trend is a part of a trading range on a higher time frame and that range itself is a part of a larger trend. Logically, each trend contains trading ranges, and each trading range is made up of smaller trends and so on, dropping down to the smallest time frame. It is very important to remember that market movement tends to build up inertia, making the markets more likely to continue doing what they have been doing, instead of shifting directions. This is why more often trend reversals and trading range breakout attempts fail, instead of being successful.
So, a market is either trending or moving sideways. When two or more candlesticks overall overlap, they form a trading range, which can have many forms, as in patterns such as triangles, flags etc. In price action the names of those forms are irrelevant. What is important is that the market is in some sort of an equilibrium, with most likely one of the two counterparts (bulls, bears) slightly overpowering the other. And as you narrow your focus even more to the level of the single candle, you will either have a trend candle or a trading range bar.
Need to know
![]() One of the most important abilities you need to develop when trading price action trends is to find out whether a trend candlestick is marking the beginning or the end of a move. Nothing is just black and white and thinking that a strong bull candle is solely bullish and a bearish one is only bearish would be a mistake. Different market players see and interpret situations differently – some will be buying at the candles top, assured by its bullish strength, while others will be waiting for a pullback and will go long after the price retreats, guided by expectations it will rebound. Others might think that spike, no matter how strong the trend, is overdone and will go short at the candles high. Therefore, it is important to remember that no matter how sure you are about the current conditions on the market, there is someone as smart as you that might be thinking exactly the opposite, thus rendering a 100%-situation impossible.
One of the most important abilities you need to develop when trading price action trends is to find out whether a trend candlestick is marking the beginning or the end of a move. Nothing is just black and white and thinking that a strong bull candle is solely bullish and a bearish one is only bearish would be a mistake. Different market players see and interpret situations differently – some will be buying at the candles top, assured by its bullish strength, while others will be waiting for a pullback and will go long after the price retreats, guided by expectations it will rebound. Others might think that spike, no matter how strong the trend, is overdone and will go short at the candles high. Therefore, it is important to remember that no matter how sure you are about the current conditions on the market, there is someone as smart as you that might be thinking exactly the opposite, thus rendering a 100%-situation impossible.
As weve mentioned above, the most important aspect of price action trading is distinguishing a trending candle from a trading-range one. Basically, if there is a body, then the price drifted away from the open and closed away from that level, which indicates a certain direction. Conversely, if the body is small, but the candle is large and made up mostly by shadows, then bulls and bears were in at least partial equilibrium, therefore we have a non-trend candlestick, or as we will call them in general – dojis.
One of the difficulties beginner traders encounter is distinguishing a pullback from a trend reversal. For example, in a bearish trend there might be one or several large bull trend bars that break through the moving average and edge several pips above it, leaving traders ambivalent about the markets next move. A general rule of thumb is that the market is always trying to reverse, but it succeeds only in 20% of the time. At the point of penetration, beginner traders will probably think that the market is reversing and will go long, but what actually they need to do, and what experienced ones will do, is wait for a follow-through buying in order to determine how to position themselves. As soon as a bar closes beyond the moving average, everyone will be watching the next one closely. Experienced bulls and bears will wait for these strong trend bars and usually step aside until one forms. Without follow-through buying, the experienced bears will interpret the situation as a climactic end of the buying and will take advantage of the situation by going short again, while the inexperienced bulls will be trapped.
Climaxes
 Speaking of climaxes, each trend bar is a part of a climax and each climax is a component of a reversal, but a climax is not equal to a reversal. As you know, a climax is a move that has accelerated too fast and has now reversed direction to either the opposite trend or a trading range. Every trend candle is a climax or a part of it and its end is marked by the first pause candle.
For example, if there are four consecutive bear candles and the next one is a doji, a bear candle with a big shadow below it or a bull candle, then the climax has ended with the four bear candles. This setup means that the market fell too much too fast, and that the selling enthusiasm has dispersed, leading to sideways trading. As the market enters this trade, its next move will be determined by the strongest amongst the bulls and the bears. If the bulls overpower the bears, then the market will reverse up with a bull trend candle, which will be acting as a bull breakout and the reversal pattern will be a climactic reversal bottom. So the bear trend bars are acting as a climax, while the bull trend bar is a breakout, creating together the climactic reversal bottom. Check the screenshot below.
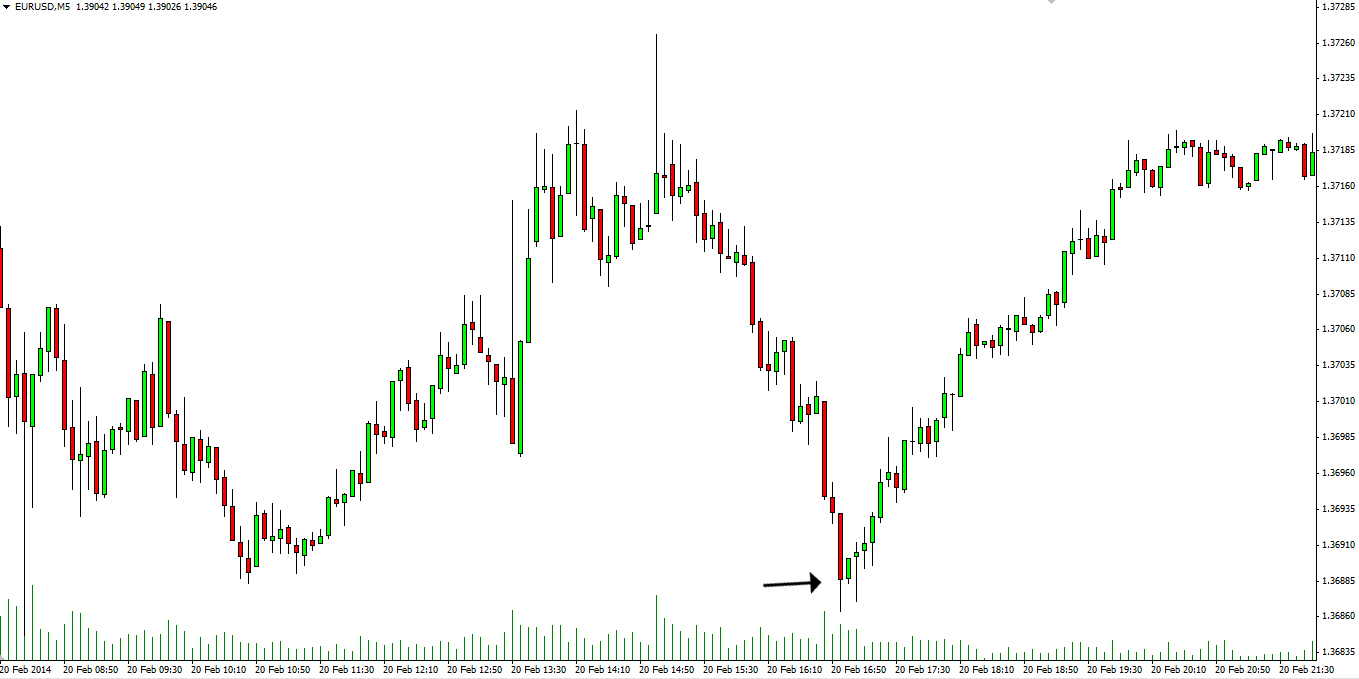
You can see in the example above that a very strong bearish trend ended with a sell climax formed by the succession of three bear candles. The last big bear trend bar was followed by a bullish inside bar, which marked a possible reversal. Moreover, the bullish candle lacked a shadow on its top (shaved top), meaning that the bulls were buying very aggressively up to its close. This provides us with solid ground for going long. Following the sell climax, the breakout above the bullish inside bar was a bull breakout. If youd switch to a higher time frame, then the spike down and the following spike up would be visualized as a two-bar reversal (we will discuss on those in a later chapter).
How should a trend bar look like

As mentioned above, a trend candlestick should have a body, meaning that the price moved away from the open and closed at a certain distance from it. Although the minimum requirement is for the candle to have some body at all, if it is too small it can be hard to distinguish it from a doji, since some dojis can have small bodies as well. The larger the body is, the bigger the display of power by the dominating counterpart is.
For example, if a candles body is about the same size or larger than the median size of the bodies of the previous 10 candles, it is considered as a much stronger signal. Other signs of strength are the lack of shadows (open is near or at the low and close is near or at the high in a bull candle and vice versa), the close and the high being at or above the closes and highs of the several previous candles etc.
Buying and selling pressure
 A key factor on the market worth considering are the institutional investors, whose cumulative positioning determines the markets direction. Strong bulls create buying pressure, while strong bears create selling pressure.
Examples for selling pressure in a bullish trend are tails at the tops of bull candles, reversal candles at the tops of upswings and an increasing number of bearish candles. The strong bears are the ones selling at each new high and at the top of each candle, which pushes down its close away from its high. Market movement begins to shift as strong bears apply selling pressure, while strong bulls decide that there is no point in buying at these high levels. And we know this, because the bulls would have been able to overpower the bears, if enough of them were willing to buy, but instead they dont and the candles close closer to their lows, instead of their highs.
As strong bears keep shorting and strong bulls are no longer willing to buy, the market enters a trading range. While the strong bears short at the top and refrain from doing so at the bottom, the strong bulls are willing to buy at the bottom and pass on the top. This however leaves many weak bulls and bears trapped, because weak bears continue to sell at lows, expecting that this is the beginning of a downtrend and prices will extend their downward movement, while weak bulls buy at the highs, worrying that they will miss on the continuation of the uptrend.
Trend candles without a trend

However, not every trend candlestick is a part of a trend. Sometimes a trend candle can form during a trading range but due to the lack of a follow-through it may even result in a strong move in the opposite direction afterwards. Take a look at the following screenshot.
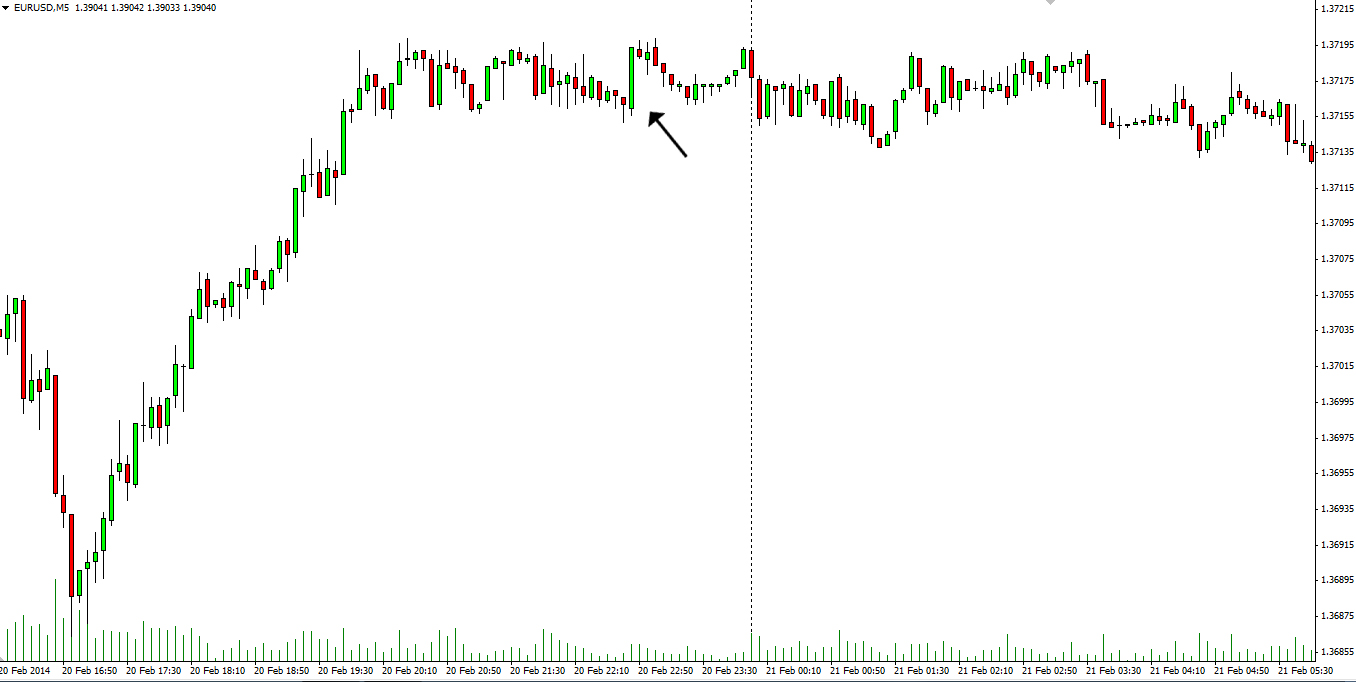
As you can see in the example above, a large bullish trend bar formed in the middle of a distinct trading range. Because there was no follow-through after that candle, even though it was shaved at the top, the next candle extended a couple of pips higher and then reversed and closed lower. Because bulls exited and market players saw this was a failed breakout, no one had any interest in buying in this situation and new shorts entered, causing the market to retain its sideways movement.
A single trend bar can often mean quite the opposite of what it is initially attempting to show us. Having held in a narrow trading range for some time, the market can be quite deceptive when it presents us a trend candle. Many inexperienced traders will jump right onto one, hoping they will catch a bull/bear trend right at the first moments of its formation and milk the most of it. However, an experienced market player would require a follow-through of at least a second or a third trend bar in order to be convinced that the market is actually going to move in that direction.
Trend bars can mark the end of a trend
 Not only can a trend candle not start a trend, but it can also end the current trend, despite having the same direction. Very often when an excessively large trend candle, say a bull candle, forms after the uptrend has moved on for 10 or even 20 candles without any significant pullback, this represents an exhaustive buy climax. This can mark the high of the trend or it can give the market a few more candles before it tries to reverse. You can learn more about exhaustion bars in chapter the “Other types of signal candles and patterns”.
As the strong bulls and bears see a resistance level that is about to be tested, they stand aside and wait for the formation of a bull trend candle. Once it forms, both of them sell – bulls exit positions and take profits, while bears short, because both of them are expecting a large correction. The trend might even possibly reverse, but market players will first need to evaluate the strength of the prices decline before committing themselves. Both strong bulls and bears know what is happening, so the bulls wont buy and the bears wont cover shorts until the market declines for at least 10 bars and at least touches the moving average. The following result is often a sharp rally, which begins with a trend bull candle.