Wedges
This lesson will cover the following
- What is a wedge?
- Types, formation and elements
- How to trade wedge patterns?
There are two varieties of the wedge pattern – the Rising Wedge and the Falling Wedge. As you can guess, they are opposite to each other, so we will mainly turn our attention to the Rising Wedge.
Although Rising and Falling Wedges are predominantly considered as reversal patterns, sometimes, depending on the trends direction, they can act as a trend continuation formation.
In general, a wedge is a market consolidation zone, bound between two sloping support and resistance lines, which would eventually converge. The price forms highs and lows in the same direction, but the pace at which the two types of extremes are formed differs.
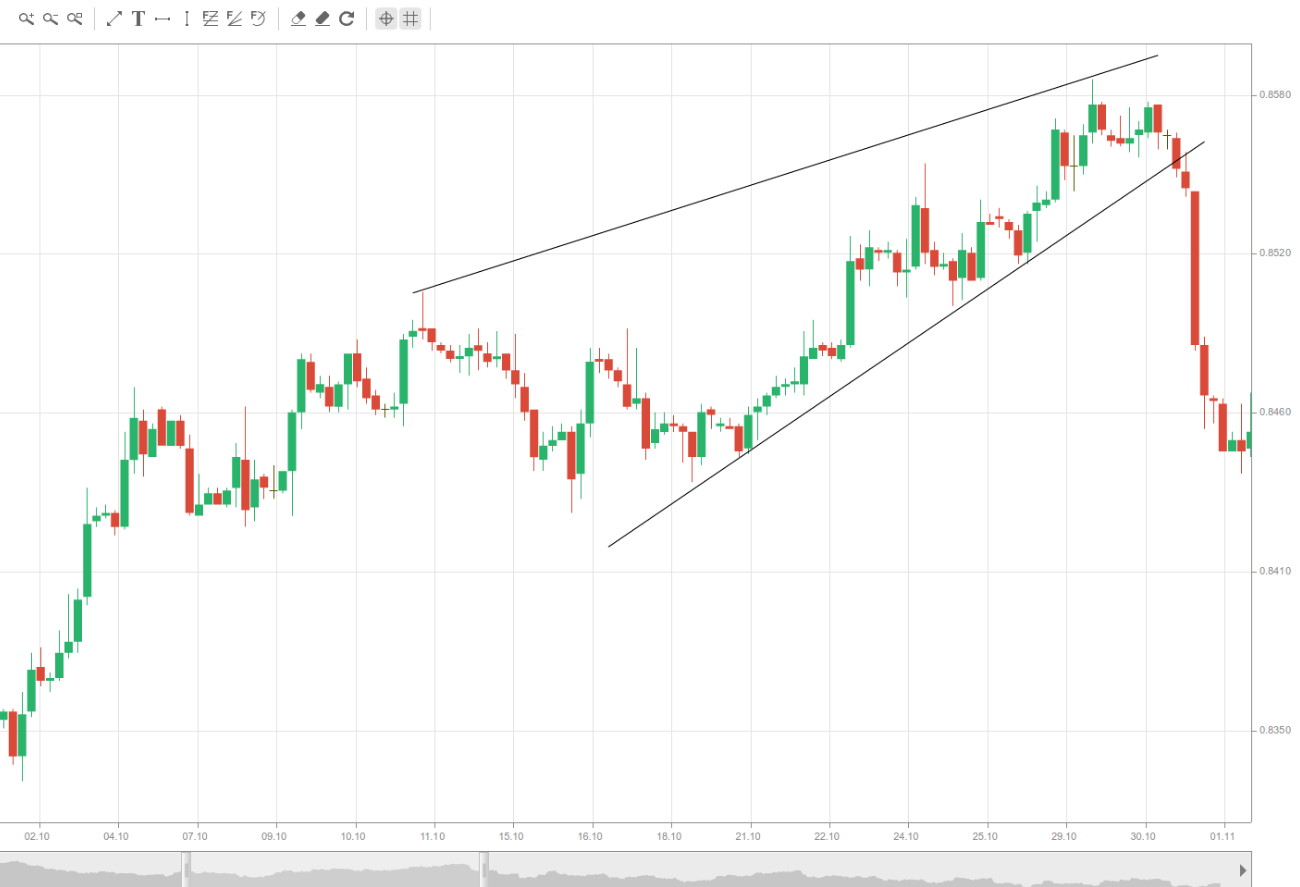
In our case, a Rising Wedge is a price action zone, bound between upward sloping support and resistance lines. One is visualized below.

As you can see from the picture, the market is forming higher highs and higher lows, but because the lows are being formed faster than the highs, the support line is steeper than the resistance. Often, such a scenario during an uptrend acts as an early sign of a possible price reversal.
However, a rising wedge during a downtrend, as illustrated on the next screenshot, often acts as a continuation pattern. It is usually a temporary price movement to the opposite side, a retracement.

Keep in mind that regardless which of the upper two scenarios we have in front of us, all Rising Wedges are bearish. Logically, all Falling Wedges, both in an uptrend and a downtrend, are bullish.
Wedge formation and elements
 Because wedges are trend continuation or reversal patterns, there must be a trend to continue or reverse. Wedges are a mid-term or long-term patterns and depending on the time frame, they could take several months to form. Sometimes the entire trend movement is contained within the wedges boundaries, while in other cases, it can form after a correction (when it coincides with the trends direction).
The formations boundaries are basically a support (or a trend) line and a resistance line. The upper line (resistance) requires at least two highs in order to be formed, but may also include three, and each of them should be higher than the preceding one.
The support line, in case the wedge encompasses the whole trend, is basically a trend line, which requires the connection of three lows. If you have a Rising wedge within a downtrend, then the support zone will require at least two lows. In both cases, just as the highs, each low should be higher than the previous one. Check the screenshot below.
If price movement forms these support and resistance lines in such a way that they are sloping and will eventually converge as the pattern matures, then we have a wedge. In a Rising Wedge, the subsequent advances from the lows become shorter over time, which is why the resistance line basically slows down and is not as steep as the support, eventually converging with it.
Having noticed that we may have a Rising Wedge, we anticipate that a price reversal might come soon. However, we can not be sure that the bears have overcome the bulls until we have a proper confirmation. Such a signal is generated when the price breaks through the support zone, preferably accompanied by increased volume, and closes a candle beneath it. It is even better to wait for a break below the wedges latest low, in order to be absolutely assured, it wont be a false breakout.
Keep in mind
 There are several other things you need to consider. First, the greater the wedges slope is, the stronger the breakout usually is.
Second, a perfect wedge consists of 5 swings within its range, and although this is not mandatory, it does make the pattern more reliable. Generally, markets indecision should be resolved by the fifth swing, after which the price supposedly should choose a direction to follow. If, however, the market takes too long to make a decision (the consolidation area becomes too long) and it requires more than 5 swings, then it can make a flax exit from the wedge, which will likely turn to sideways trading.
Sometimes, however, the market might not finish the fifth swing toward the resistance and turn back, showing that the bulls are rapidly losing their strength and providing an early clue of a possible downward breakout.
Third, using MACD allows you to more effectively trade the wedge patterns, as it often enables you to spot a possible shift in the trend before the actual breakout.
Two common ways to trade the Wedge pattern
 There are generally two common ways to trade Wedges, and they are pretty similar to what we discussed in the article covering the Head and Shoulders pattern. The first way is to enter a short or long position right after the breakout through the support/resistance line of the Rising/Falling Wedge has been confirmed. And the second method, when possible, is to wait for the price to retest the broken support/resistance after it switches its role to resistance/support and enter a position after that. So, here are the two scenarios.
Once the wedge is identified according to the previously noted requirements, we can expect that a trend reversal might occur. In order to profit from this situation, we must go short right after the price breaks out through the support line.
However, as with any other breakout, we must wait for a confirmation in order to reduce the risk of committing to a false breakout. You need to wait for a candle to close below the broken support. It would be even better to wait for the price to fall below the Rising Wedges last low, if it hasnt yet. You can see this scenario pictured below.
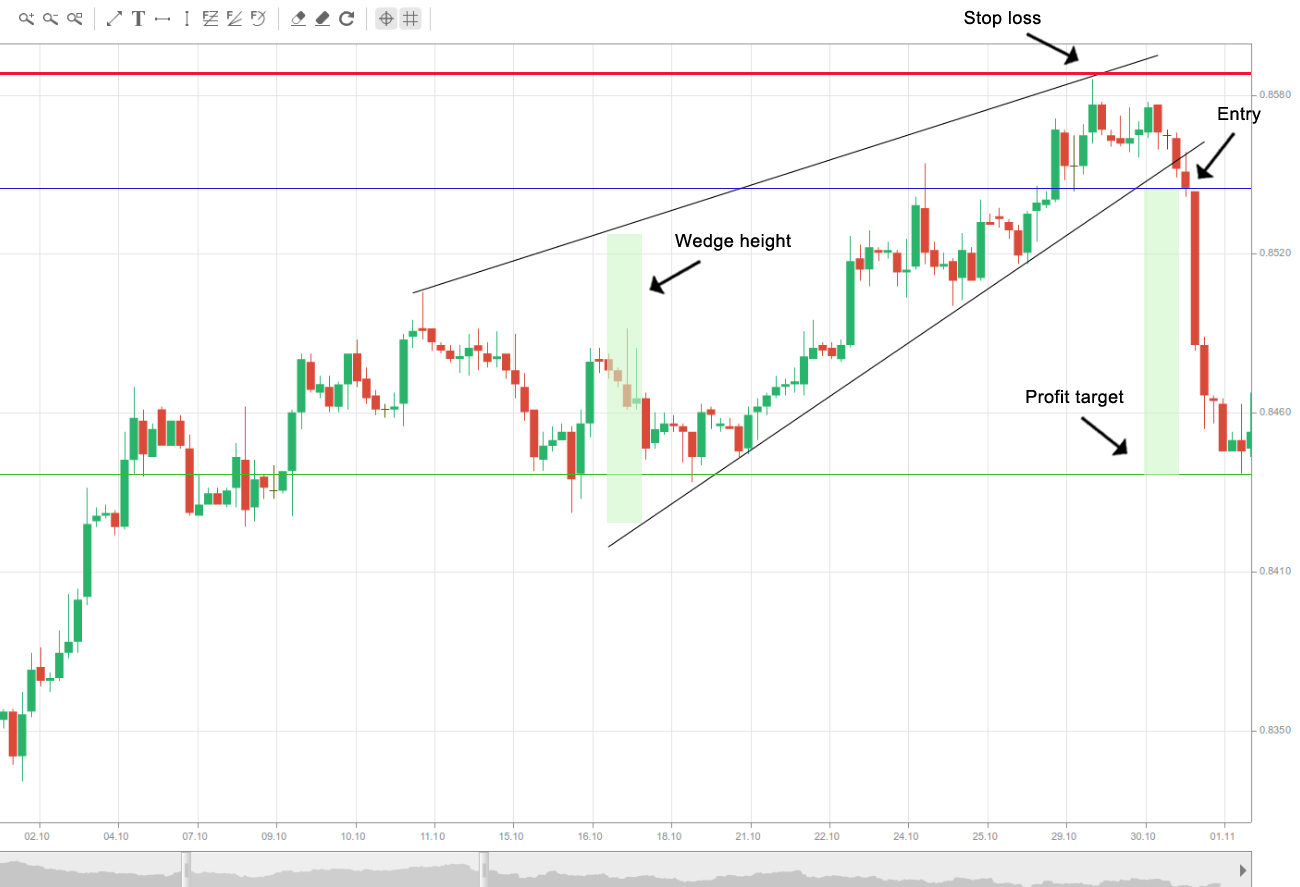
As for the stop loss and profit target, which you can see illustrated as well, here is how to estimate them. The protective stop should be placed several pips above the highest high of the Wedge.
Meanwhile, the profit target should be equal to the height of the Wedge in its backside. Having estimated that distance in pips, you then need to subtract it from your short entry point, as visualized on the screenshot.
The second way to trade a Wedge breakout follows the same logic as with the Head and Shoulders pattern. It can be used when we have a pullback/throwback and the broken support/resistance line is then retested, as it switches roles. In the case of a Rising Wedge, the price will retest the broken support as a resistance and if it rebounds from it, you must enter a short position, as illustrated on the screenshot below.
In our case, the stop loss should be placed several pips above the resistance line, so that no random noise and failed attempts to break it manage to trigger it. Unlike the first scenario, the stop is not placed above the pattern itself, because if the price manages to break back above the resistance, then the pattern will be deemed flawed anyway, and you wouldnt want to lose those extra pips.
As for the profit target, it follows the same logic as the first scenario. You take the Wedges height in its back and plot it down from the entry point, as pictured in the example above.