Relative Strength Index
This lesson will cover the following
- What is the Relative Strength Index
- How is it calculated and visualized
- What does it tell us
- How can it be of benefit
The Relative Strength Index is one of the most widely used tools in traders handset. The RSI is an oscillating indicator which shows when an asset might be overbought or oversold by comparing the magnitude of the assets recent gains to its recent losses. A common misconception is that the RSI draws a comparison between one security and another, but what it actually does is to measure the assets strength relative to its own price history, not that of the market.
The Relative Strength Index is useful for generating signals to time entry and exit points by determining when a trend might be coming to an end or a new trend may be forming. It weighs the prices upward versus downward momentum over a certain period of time, most often 14 periods, thus showing if the asset has moved unsustainably high or low.
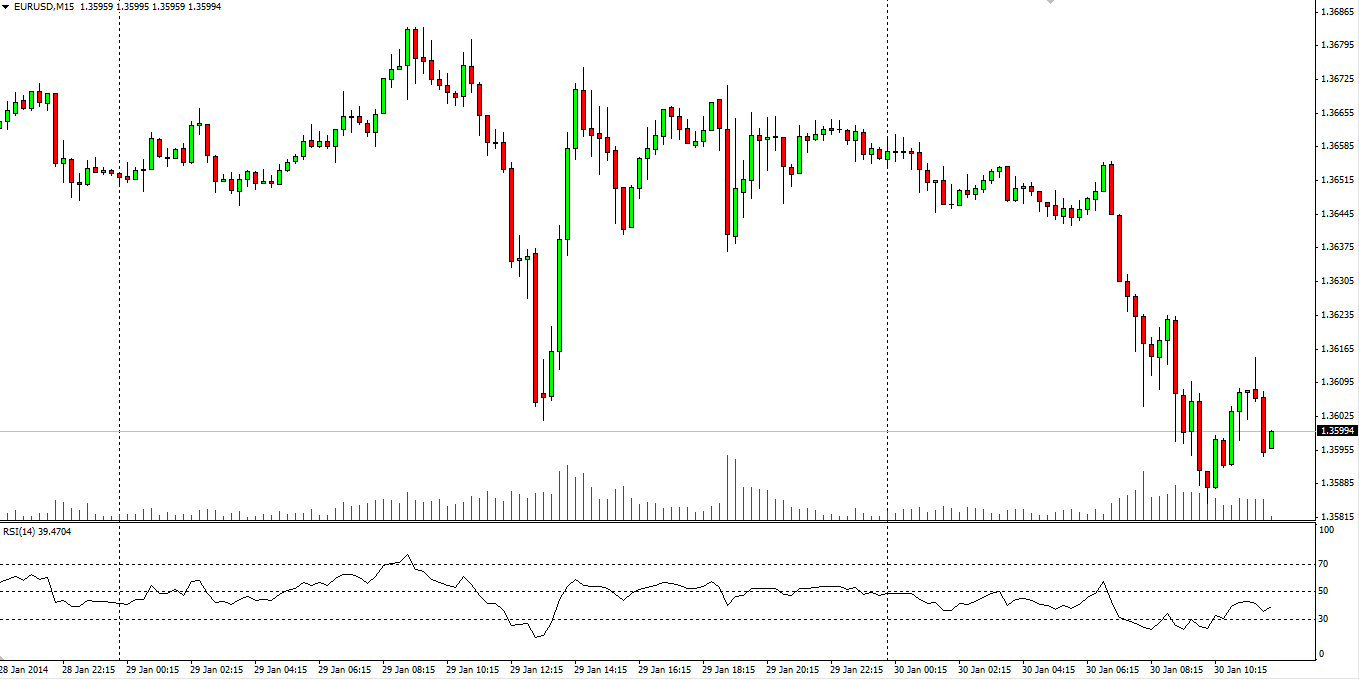
The RSI is visualized with a single line and is bound in a range between 1 and 100, with the level of 50 being considered as a key point distinguishing an uptrend from a downtrend. You can see how the RSI is plotted on a chart on the following screenshot.
J. Welles Wilder, the inventor of the Relative Strength Index, has determined also two other fundamental points of interest. He considered that an RSI above 70 indicates that the asset is overbought, while an RSI below 30 suggests an oversold situation. These levels however are not strictly set and can be manually switched, according to each traders unique trading system. Trading platforms allow you to choose any other value as overbought/oversold boundary apart from the conventional levels.
How is RSI calculated?
 Constructing the RSI requires several calculations to be made. The formula is as follows:
RSI = 100 – [100 / (1 + RS)]
Where the RS (Relative Strength) is the division between the upward movement and the downward movement, which means that:
RS = UPS / DOWNS
UPS = (Sum of gains over N periods) / N
DOWNS = (Sum of losses over N periods) / N
As for the period used for tracking back data, Wilders original calculations included a 14-day period, which continues to be used most often even today. It however can also be a subject to change, according to each traders unique preferences.
After the estimation of the first period (in our case the default 14 days), further calculations must be made in order to determine the RSI after a new closing price has occurred. This includes one of two possible averaging methods – Wilders initial and still most commonly used exponential averaging method, or a simple averaging method. We will stick to the most popular approach and use exponential smoothing. The UPS and DOWNS for a 14-day period will then look like this:
UPSday n = [(UPSday n-1 x 13) + Gainday n] / 14
DOWNSday n = [(DOWNSday n-1 x 13) + Lossday n] / 14
What does the RSI tell us?
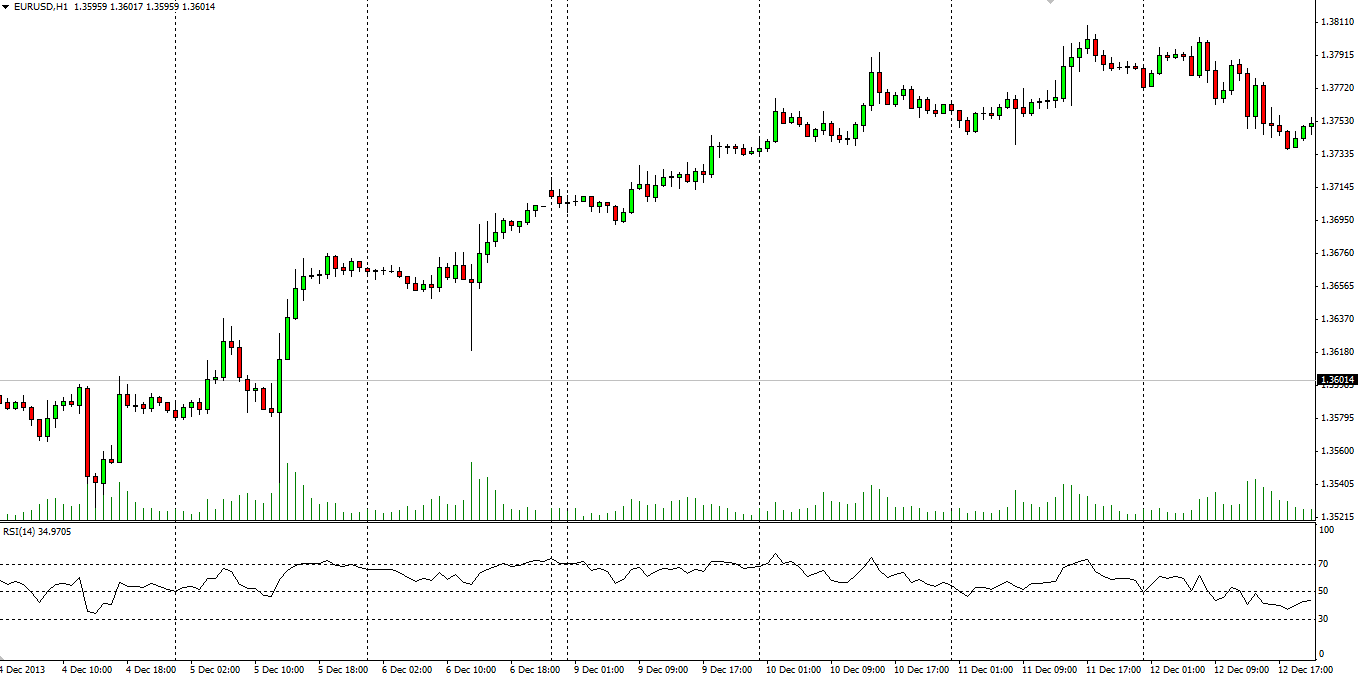
 There are several signals that the Relative Strength Indexs movement generates. As we said earlier, this indicator is used to determine what kind of trend we have and when it might come to an end. If the RSI moves above 50, it indicates that more market players are buying the asset than selling, thus pushing the price up. When movement crosses below 50, it suggests the opposite – more traders are selling rather than buying and the price decreases. You can see an example of an uptrend below where the RSI remains above 50 for the duration of the move.
However, do keep in mind to use the RSI as a trend-confirmation tool, rather than just determining the trend direction all by itself. If your analysis is showing that a new trend is forming, you should check the RSI to receive additional confidence in the current market movement – if RSI is rising above 50, then you have a confirmation at hand. Logically, a downtrend has the opposite properties.
Overbought and oversold levels
 Although trend confirmation is an important feature, the most closely watched moment is when the RSI reaches the overbought and oversold levels. They show whether a price movement has been overdone or it is sustainable, thus, indicating if a price reversal is likely or if the market should at least turn sideways and see some correction.
The overbought condition suggests a high probability that there are insufficient buyers on the market to push the asset further up, thus leading to a stall in price movement. The reverse, oversold, level indicates that there are not enough sellers left on the market to further push prices lower.
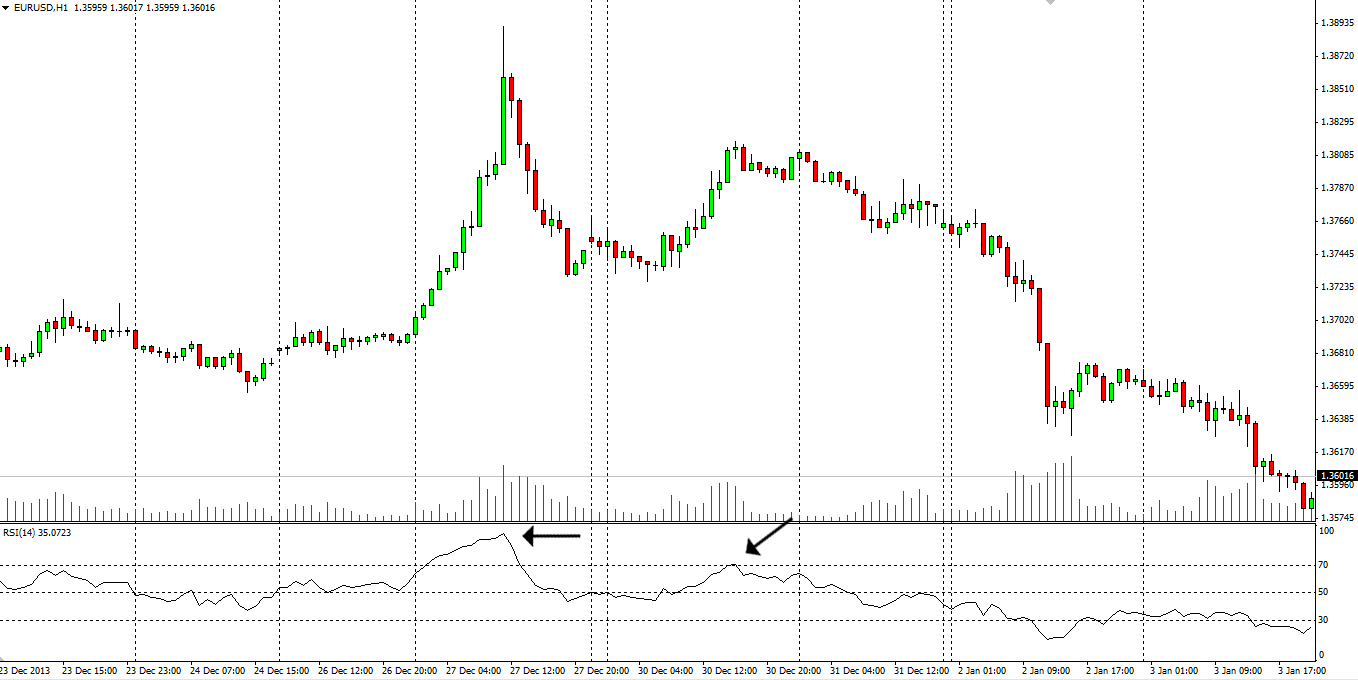
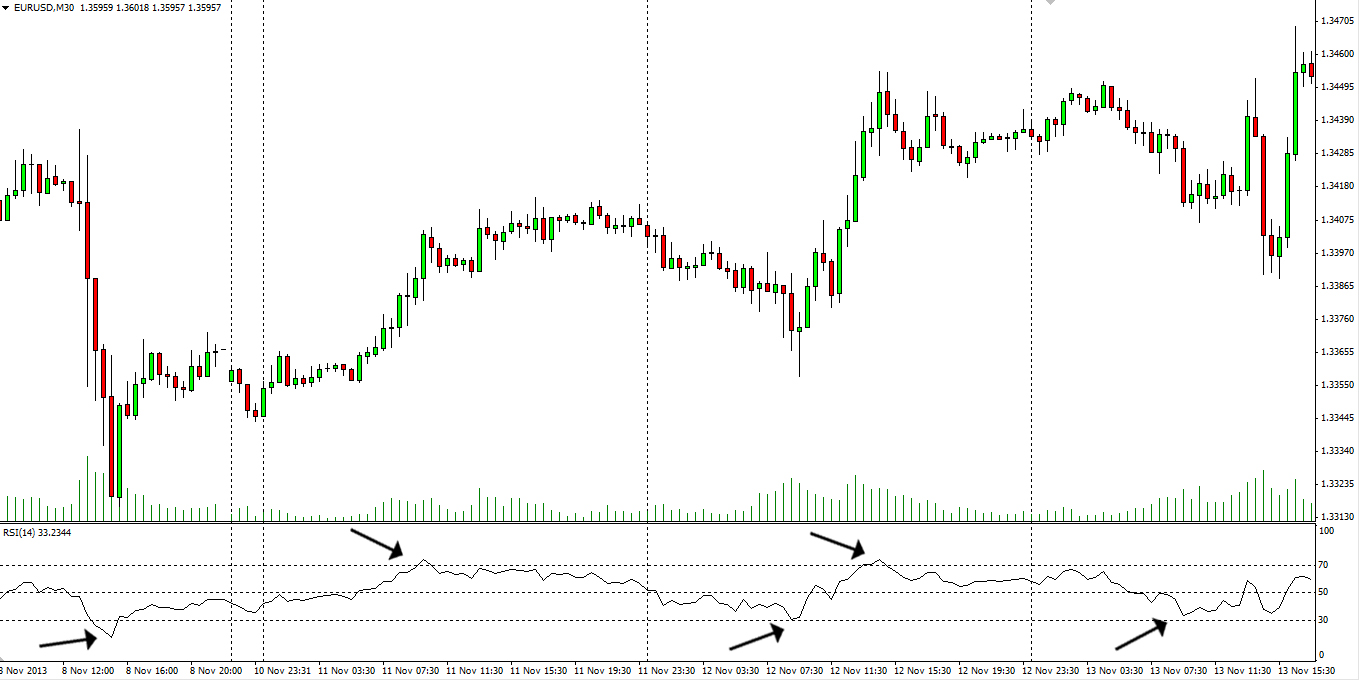
This means that when the RSI hits the overbought area (in our case 70 and above), it is very likely that price movement will decelerate and, maybe, reverse downward. Such a situation is pictured on the screenshot below. You can see two rebounds from the overbought level with the first move being extraordinary strong and bound to end with a price reversal, or a correction at least.
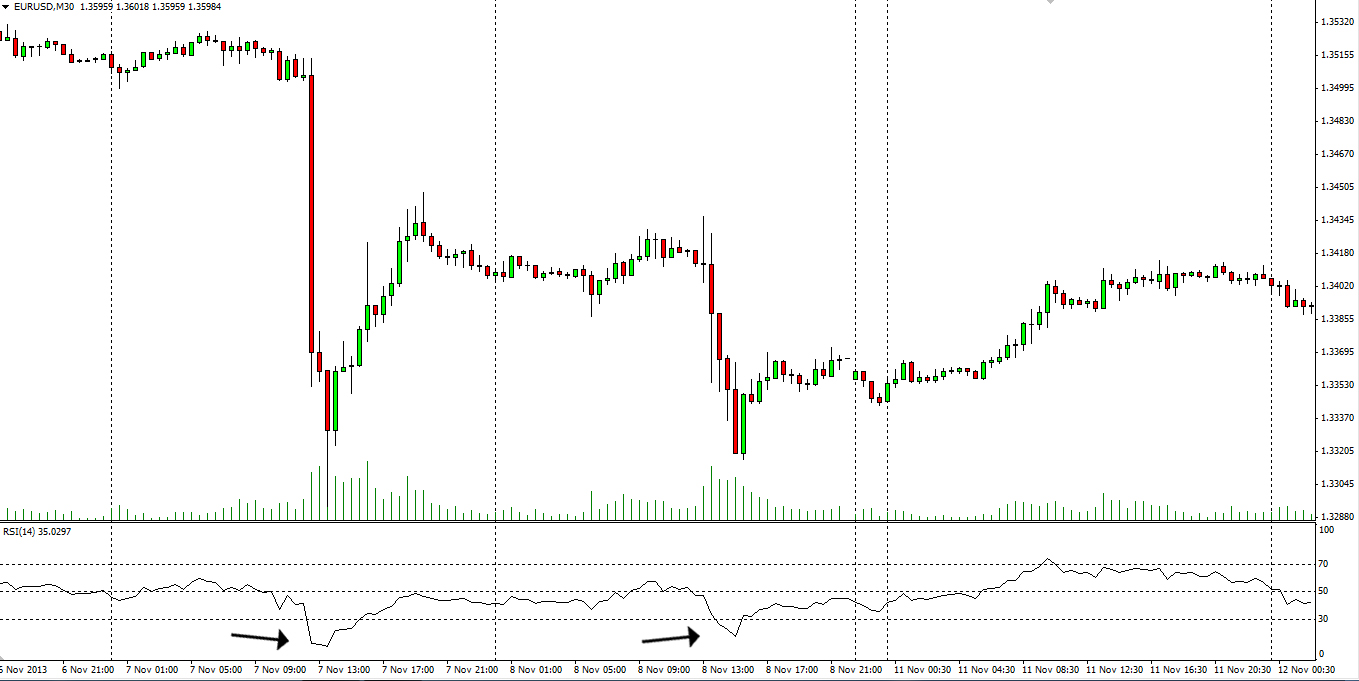
Logically, the opposite is also true. When the RSI nears the oversold level, it is common that the downward movement is coming to an end. Such a scenario is visualized below.
Having noted that prices tend to rebound from overbought/oversold levels, we can therefore reach the conclusion that they tend to act as support/resistance zones. This means that we can use those levels to generate entry and exit points for our trading session. As soon as the price hits one of the two extremes, we can use the Relative Strength Index to confirm a probable price reversal and enter an opposite position, hoping that prices will reverse in our favor. We can then set the opposite extreme level as a profit target. Check the following screenshot where you can notice how the RSI line tends to bounce between the two extreme levels.
Changing the RSI settings
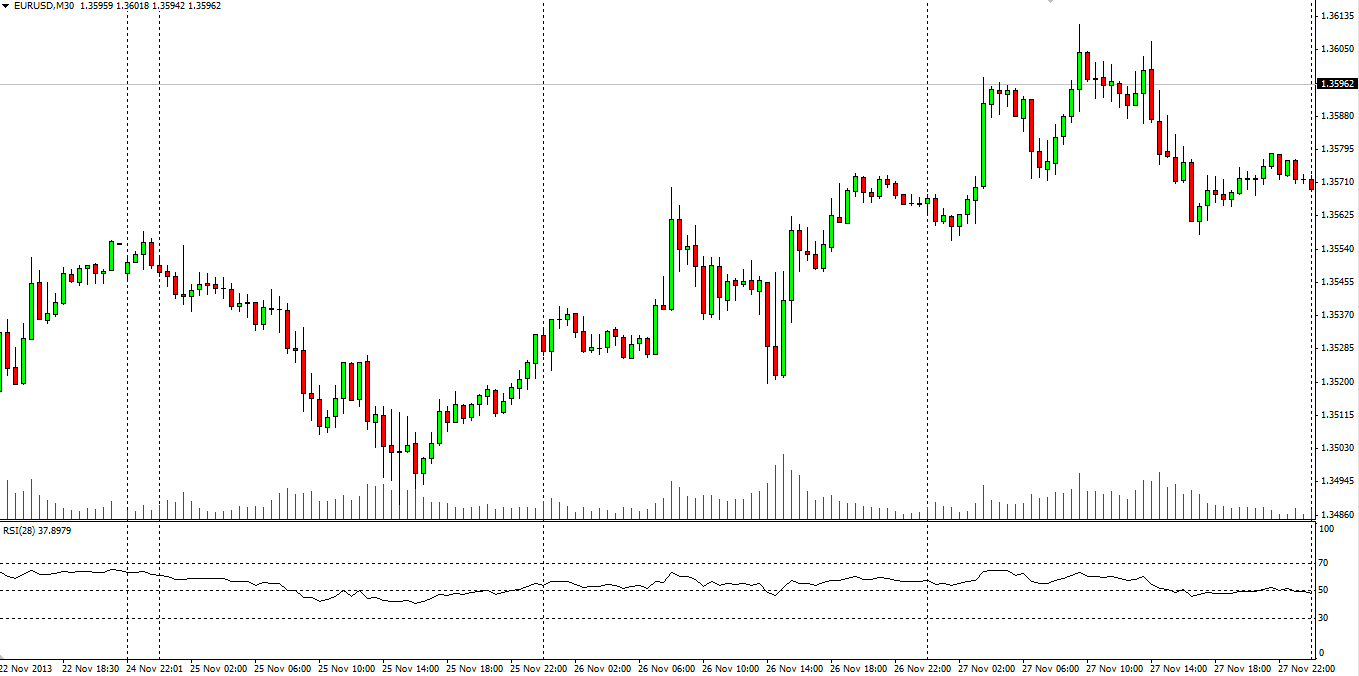
 We mentioned earlier that the most commonly used period to calculate the RSI is 14 periods, as suggested by its inventor. This setting, however, is subject of change according to each traders uniquely tuned trading system. As with each other indicator however, the larger the period of data included, the more smoothed the line visualizing the indicator will be. Therefore, it will produce less false signals, but the ones it does generate, will most likely be lagging the price action too much. On the screenshot below we have illustrated how an RSI calculated on the base of 28 periods (twice more than usual) looks like.
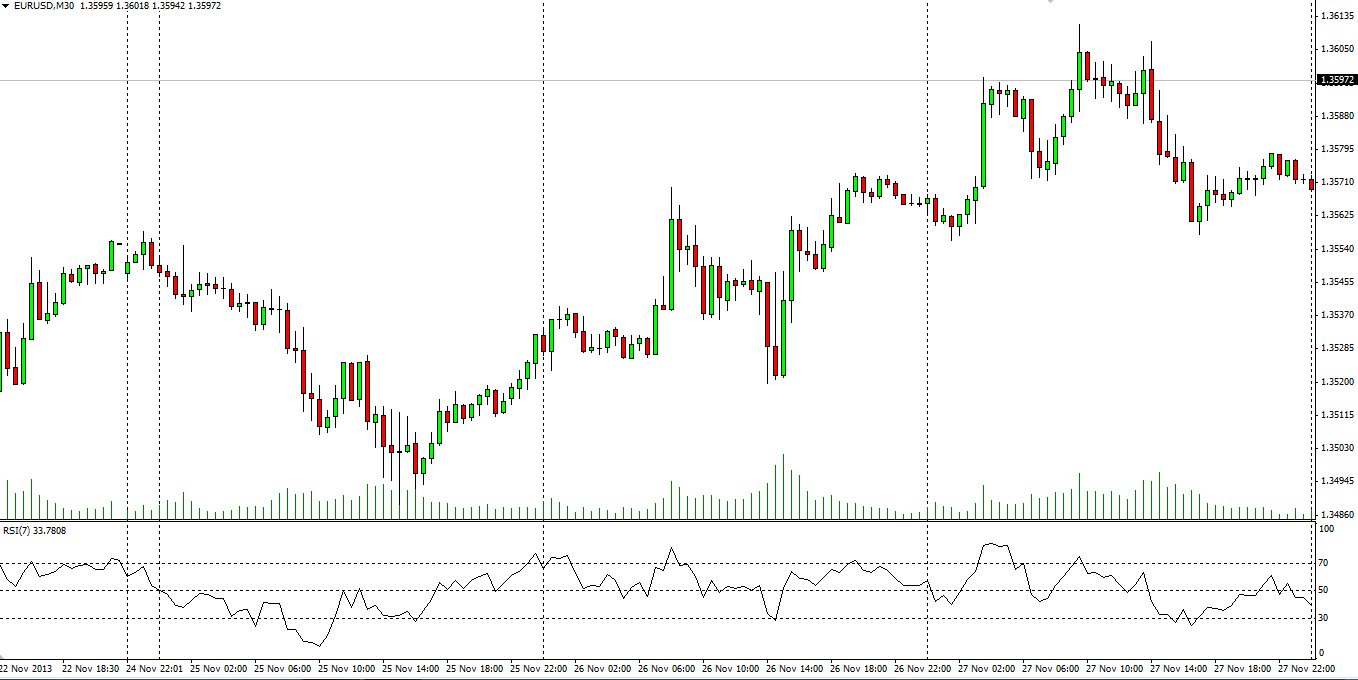
Logically, the RSI line will be fluctuating much more each time when we reduce the periods of data tracked back. The lower the number of periods, the closer the RSI will be following the price movement and, thus, will allow you to identify overbought and oversold situations much earlier, but at the cost of many more false signals. The same price action is pictured below, but with the RSI period tuned down, so that you can compare the two extremes.
As you can see, both of these periods deviating from the default level dont seem so suitable, especially for novice traders. We suggest that you first do extensive testing using the conventional 14-period time frame and then, if you are not satisfied, try out a setting that personally suits you best. But dont forget to scrutinize the new setting as well, before incorporating it in your real-account trading strategy.