Head and Shoulders pattern
This lesson will cover the following
- What is a “Head and Shoulders” formation?
- How can it be confirmed?
- How can it be traded?
The Head and Shoulders pattern forms after an uptrend, and if confirmed, marks a trend reversal. The opposite pattern, the Inverse Head and Shoulders, therefore forms after a downtrend and marks the end of the downward price movement. In the current article we will only discuss the Head and Shoulders pattern, because the inverse variety is its twin, but from a bullish point of view.
As you can guess by its name, the Head and Shoulders pattern consists of three peaks – a left shoulder, a head and a right shoulder. The head should be the highest (what an abomination it would be otherwise) and the two shoulders should be at least relatively of equal height. As the price corrects from each peak, the lows it retreats to form the so-called neckline, which is later used for confirming the pattern (we will get to that soon enough). Here is how an H&S pattern looks like.

Other key elements of this pattern and its trade process are the breakout, protective stops, profit target and volume, which is used as an additional tool to confirm the trend reversal. So here is how you identify the Head and Shoulders pattern and how its individual components are characterized.
Formation and confirmation
 In order to have a trend reversal pattern, you definitely need a trending market, which in our case should be an uptrend.
While prices are trending up, our future patterns left shoulder forms as a peak, which marks the high of the current trend. For the shoulder to be formed, the price then needs to correct down, retreating to a low, which is usually above or at the trend line, thus, keeping the uptrend still in force. This low marks the first point used to determine where the neckline stands.
Afterwards, a new higher peak begins to form, stemming from the left shoulders low, which is our patterns head. As the market makes a higher high (the head), it then corrects back and usually this is the point where the upward trend is penetrated, thus signaling a shift in momentum and a possible Head and Shoulders pattern.
The second low that is touched after the retreat from the heads peak is the other point used to build the neckline, which is basically a line drawn through the two lows.
The subsequent rebound from the second low forms the third peak – the right shoulder. It should be lower than the head and overall match the height of the left shoulder (keep in mind that exact matches rarely occur). It is also preferable that the two shoulders have required relatively the same amount of time to form as this would make the pattern stronger.
In order for the Head and Shoulders pattern to be confirmed, the retreat from the the third peak (the right shoulder) should penetrate the neckline and a candle should close below it.
The neckline itself should be horizontal in the perfect case scenario, but that rarely happens. Instead, most often it is sloping up or down and that is of significance as well – a downward-sloping neckline is more bearish than an upward-sloping one.
Volume
 As mentioned above, volume plays a key role as a confirmation tool and can be measured via indicators or by just analyzing its levels. Presumably, volume during the left shoulders advance should be higher than during the subsequent one, because as the head hits a higher high on the base of declining volume, this serves as an early signal for a possible reverse. This, however, does not happen every time.
The next step of confirmation comes when volume increases during the decline from the heads peak and the last nail in the coffin is when volume gains further during the right shoulders decline.
Trading the pattern, stops and profit targets
 We said earlier in the article that the Head and Shoulders pattern is deemed confirmed, if the right shoulders decline penetrates through the neckline and a candle closes below it. As soon as that happens and you are reassured that it is not a false breakout, you can enter into a short position. However, as you already know, no trading decisions should be made on the go, i.e. you need to have predetermined where your protective stop is going to stand and what your profit target is.
Protective stop
 There are two common places where you can place your stop loss. The first one, which is more conservative, is right above the peak of the head, while a more standard position is right beyond the right shoulder. You can see those visualized on the following screenshot.
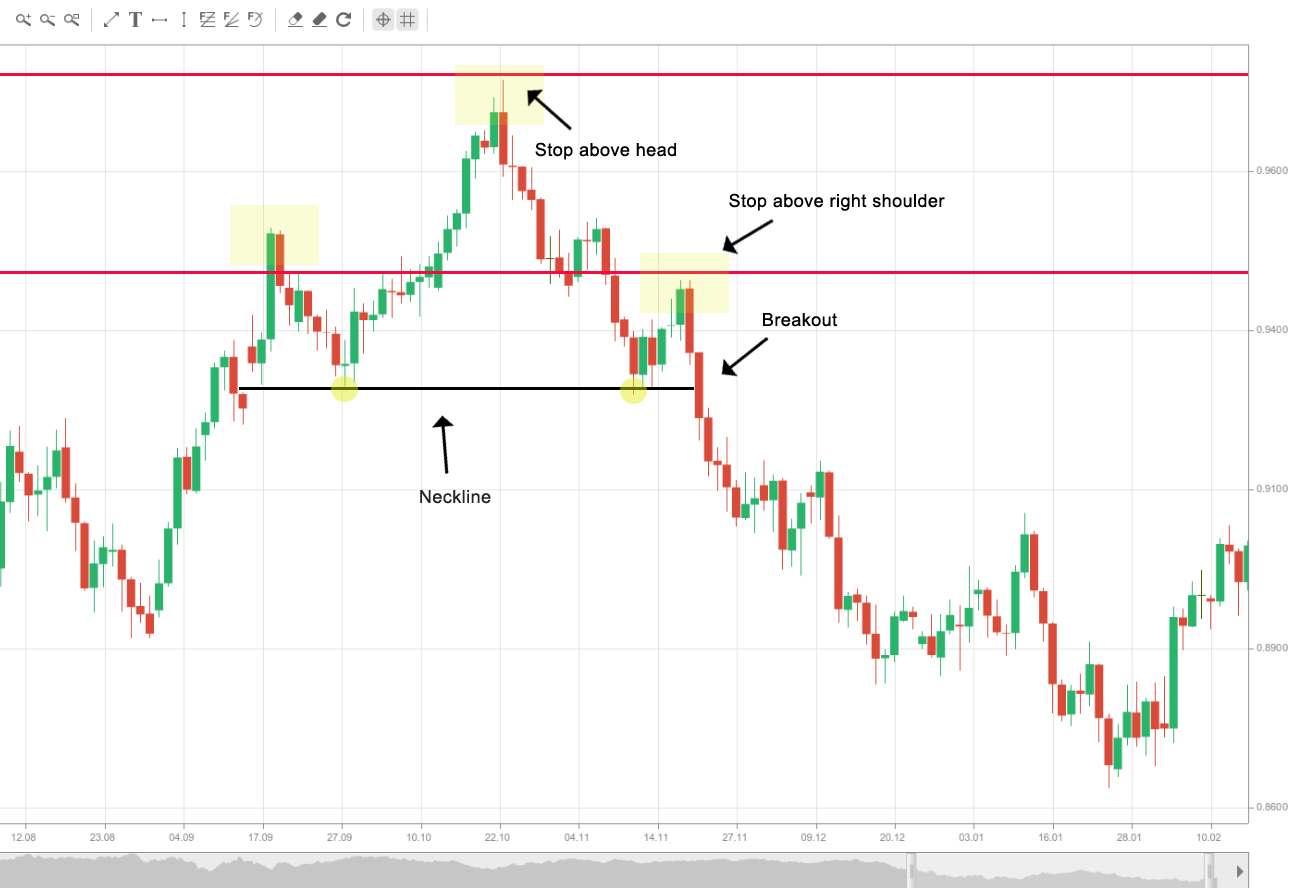
The second option makes more sense, because if the breakout through the neckline actually fails and the price rebounds back with such a momentum that it rises beyond the right shoulder, then the whole pattern is flawed and you definitely do not need to wait for it to exceed the head as well. Besides, such a loose stop significantly increases the risk and reduces the risk/reward ratio (you will see why in the next part of the article), thus, reducing this patterns trading appeal.
Profit target
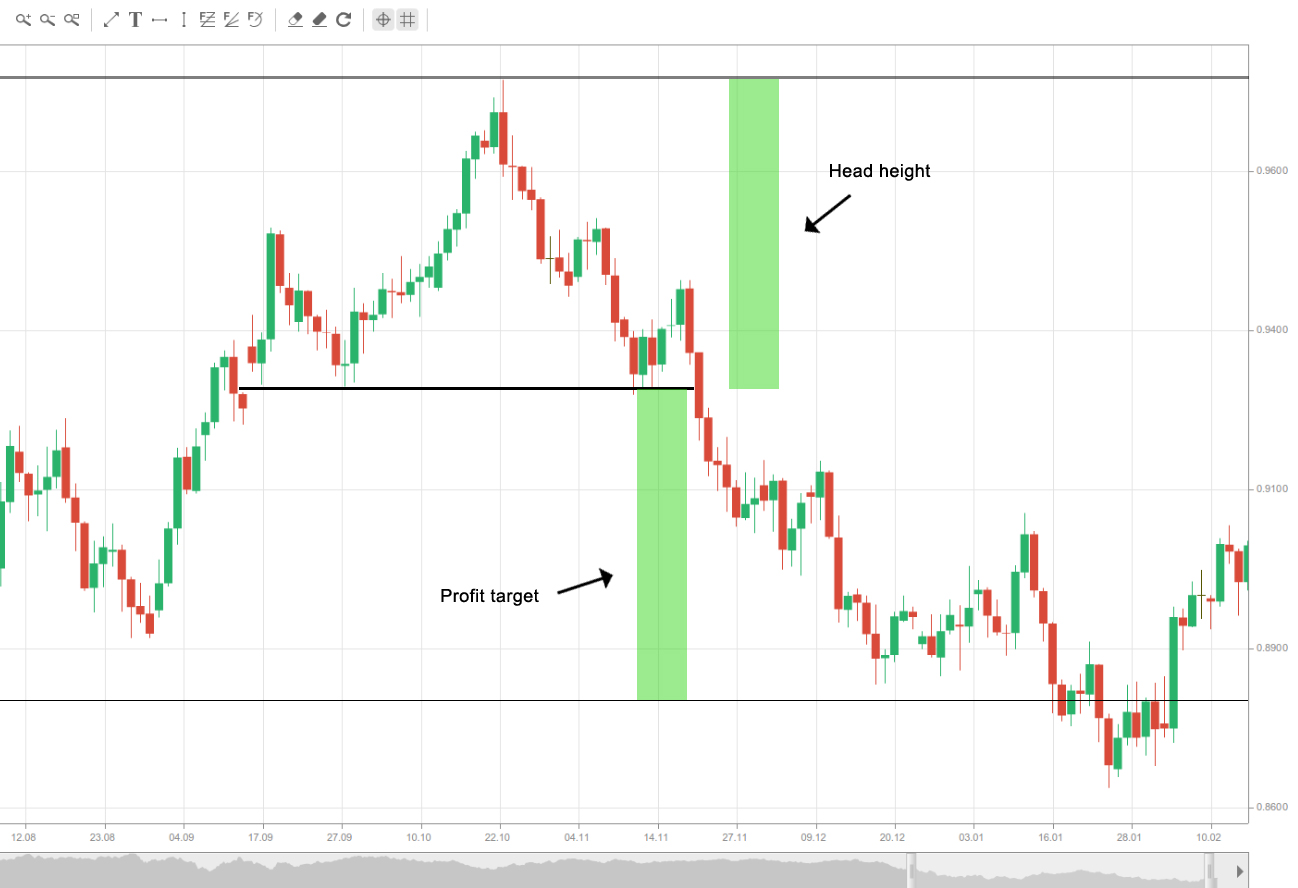
 The most common and often advised profit target is the distance (number of pips) between the heads peak and the neckline. Having estimated that distance, you then need to subtract it from the neckline, just like on the screenshot below.
And how does that translate in terms of risk/reward ratio? If the breakout confirmation (the close beyond the neckline) appears very close to the neckline itself, and we enter into a short position there, we generally have a 1:1 risk-to-reward proportion, if we use a conservative protective stop. Why?
Since our profit target is the distance between the heads peak and the neckline, if we decide to use the conservative option for a protective stop, then we will have the same distance as a loss limit, thus, reducing our risk-to-reward ratio to 1:1.
This is why, in order to improve that ratio, most experienced traders place their protective stops more often above the right shoulders peak, given that they use the head-to-neckline profit target.
However, keep in mind that this price distance should serve as a rough target, because things are usually not that straightforward and other factors such as previous support levels, crossing mid-term and long-term moving averages etc. must be taken into consideration as well.
Two ways to trade the Head and Shoulders Pattern
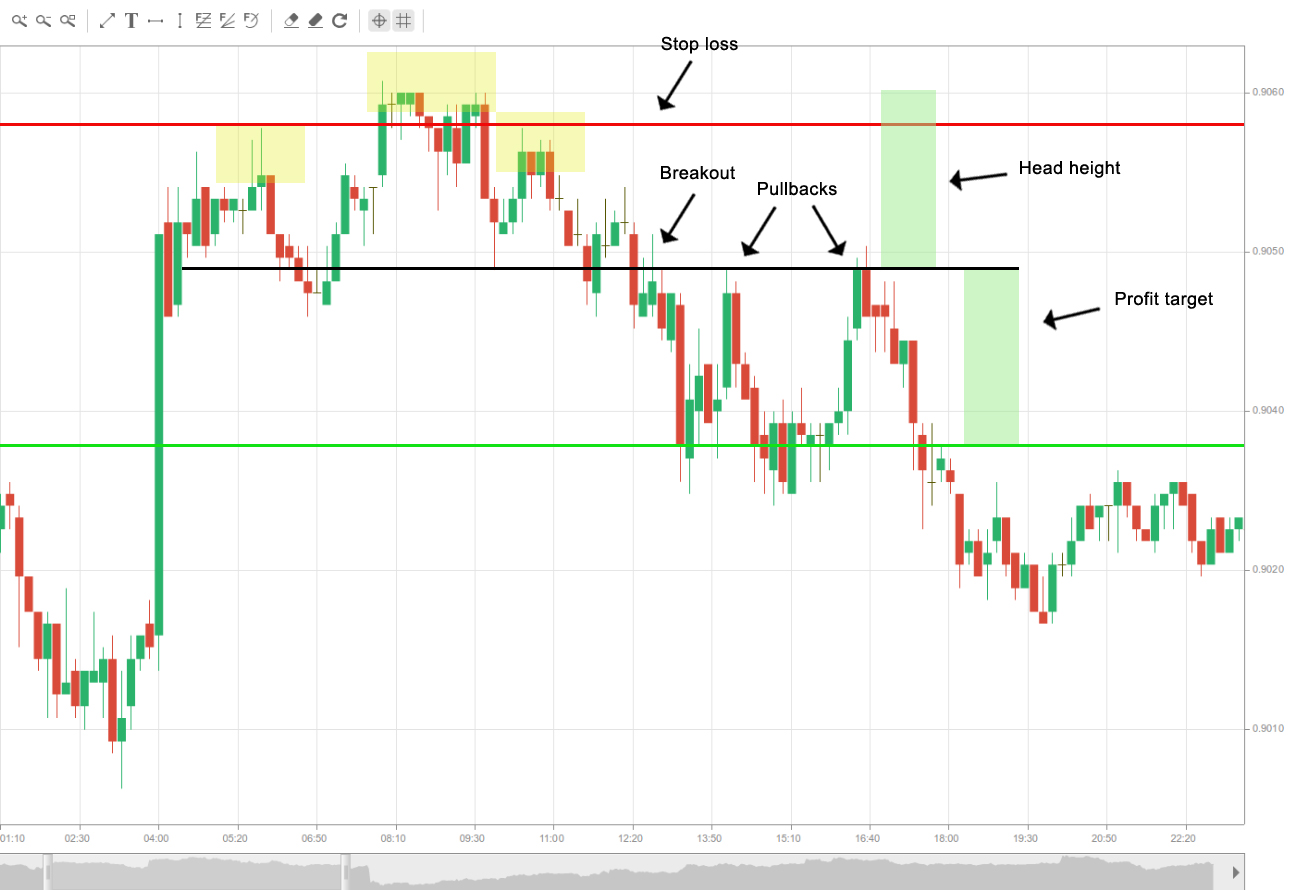
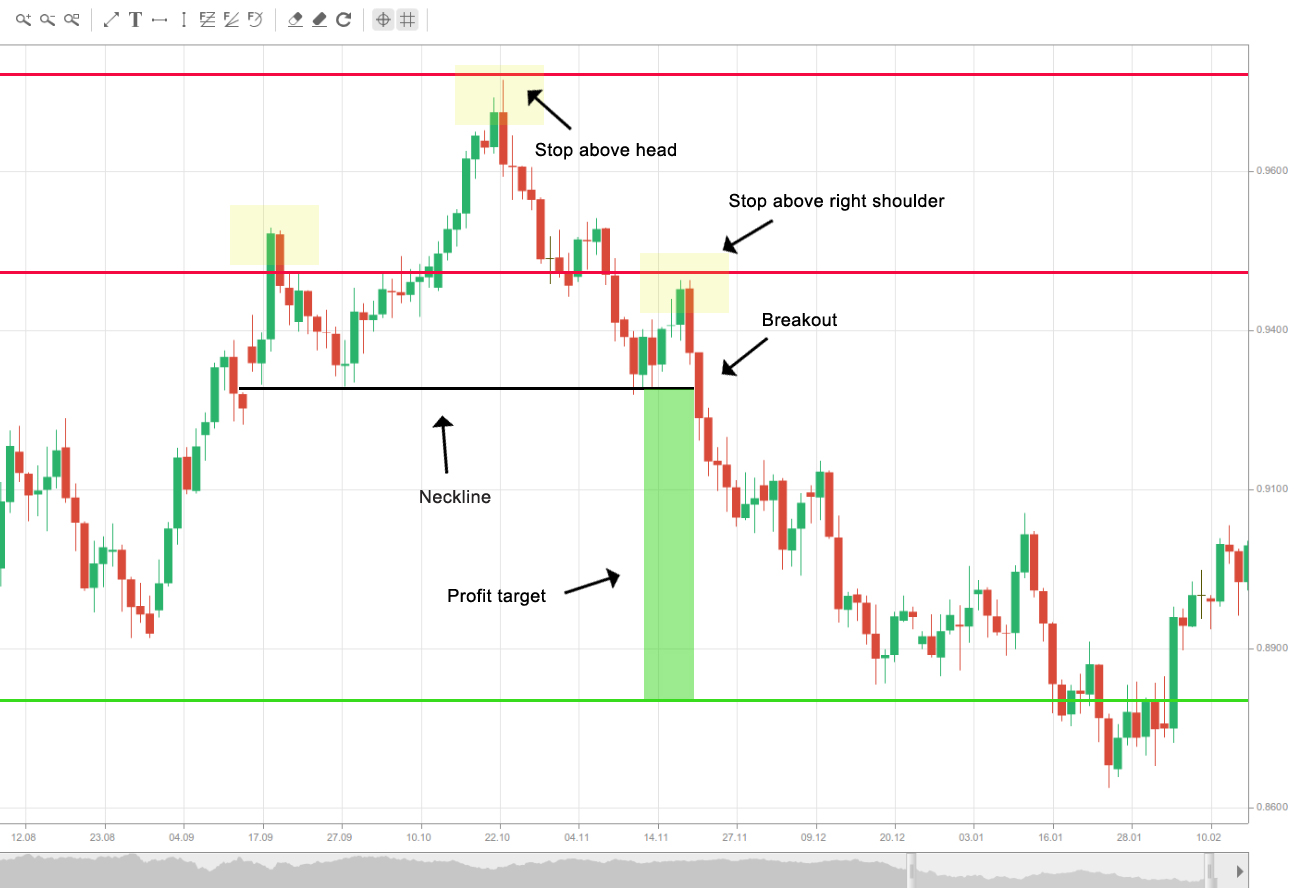
 There are generally two ways to trade this pattern, depending on how it plays out. The first one weve already mentioned. As soon as a candle closes below the neckline as a sign of confirmation, you enter into a short position with the respective profit target and protective stop like described above. This is how it would look like.
Now for the second way to trade the H&S formation. In this case we have a pullback after the neckline penetration, which, once support, now acts as a resistance level. This time we need to go short once the price pulls back and tests the neckline as resistance. As soon as it rebounds from the neckline, we enter into a short position, using the same principle for placing the protective stop and aiming for the same profit like in the first scenario. Here is how this would look like.