Consumer Price Index and Producer Price Index
This lesson will cover the following
- What is the Consumer Price Index?
- How do traders read the Consumer Price Index report?
- What is the Producer Price Index and how do traders read it?
The Consumer Price Index in general
 The Consumer price index (CPI) is a major gauge of inflation for one economy. This index is based on a basket of goods and services bought and used by consumers on a daily basis. In the United States the Bureau of Labor Statistics (BLS) surveys the prices of 80 000 consumer items in order to calculate the index. The index reflects prices of commonly purchased items by primarily urban households, which represent about 87% of the US population. The Bureau processes price data from 23 000 retail and service businesses.
The CPI includes sales taxes, but excludes income taxes, prices of investments such as stocks and bonds and sales prices of homes.
 The CPI report is usually released on a monthly basis (approximately in the middle of the month) and covers data regarding the preceding month. The BLS publishes this report at 13:30 GMT (8:30 AM EST).
The most watched figure is the Core CPI, which does not include food and energy prices. It will usually be presented as a seasonally adjusted figure, because consumer patterns are widely variable depending on the time of the year.
The Core CPI is an important measure, because this is the gauge, which the Federal Reserve Bank examines in order to adjust its monetary policy. The Fed uses the core CPI, because prices of food, oil and gas are highly volatile and central banks tools are slow-acting. In case prices of gas surge considerably, this could lead to high rate of inflation, but the central bank will not take action until this increase affects prices of other goods and services.
More reflective
Another type of CPI, released along with the Core CPI, is the Chain-Weighted CPI. We can say that it presents the effects of consumer choice. Chain-weighted CPI figures are considered by many analysts to be more reflective of actual consumer patterns than fixed CPI figures, because the chain-weighted index takes into account the substitution and new product bias, which exists in the fixed CPI.
If a consumer purchases one product over another, because of an increased price of the first product, chain-weighted indices will reflect this buying shift, while the Core CPI will not. The Core CPI will still gauge the price of the product as it surges, without taking into account the fact that fewer people are purchasing this product.
How do traders read the Consumer Price Index report?
 The CPI is an indicator with a predictive nature. The report on CPI often moves stock, currency and bond markets, both during the day of the release and on an ongoing basis. It may even set a new course in the markets for future periods. After digesting the CPI report, traders and analysts will usually be provided with clues over what actions may be considered by the Federal Reserve or the European Central Bank at their upcoming policy meetings.
In case we have a expanding economy and the annualized core CPI accelerates more than projected during a given period, approaching the inflation target set by the central bank, this may be considered as a signal that economic recovery is probably picking up the pace, thus traders would tend to support the national currency.
In case we have a sluggish economy and the annualized core CPI rises at a lesser-than-projected pace during a given period, this may be considered as a signal that inflationary pressure remains weak and accommodative monetary policy is still needed in order to spur economic growth, thus traders would tend to sell the national currency.
On the other hand, as we have already noted in a previous article, quite high rate of inflation (well above central banks inflation objective, which provides price stability) can be harmful to an economy.
Example
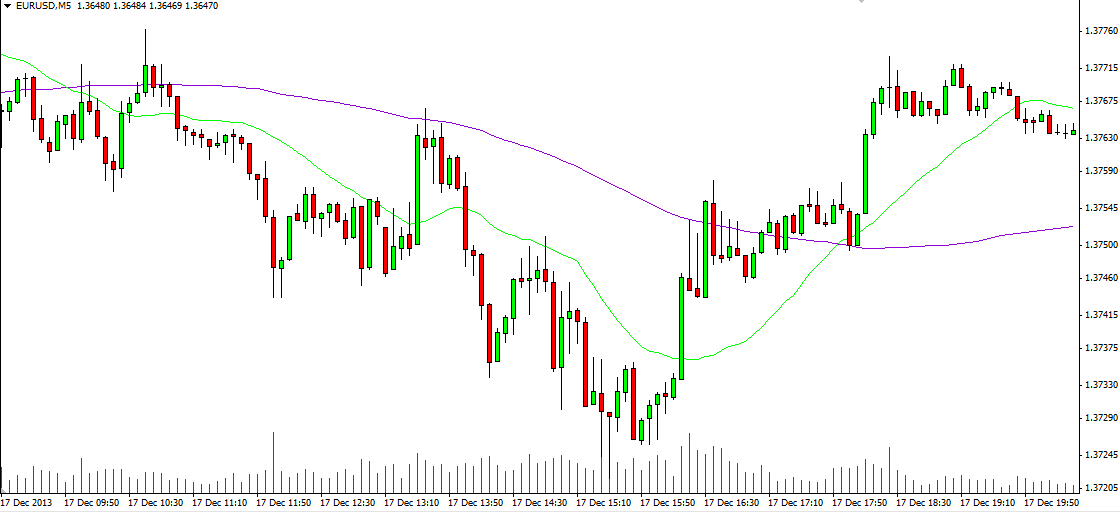
Source: MetaTrader 4 by MetaQuotes Software Corp.
The chart above visualizes how EUR/USD reacts to the release of the CPI out of the United States at 13:30 GMT on December 17th. According to the report, the overall CPI remained flat in November compared to October, while the annualized CPI increased to 1.2% in November, meeting preliminary estimates. Annualized core CPI was reported to have increased 1.7% in November again in line with expectations. These data points have been considered rather as positive by market players and EUR/USD cross retreated about 30 pips (the sequence of five red candles on the chart).
The Producer Price Index in general
The Producer price index (PPI) measures the average change over time in the selling prices received by domestic producers for their output. The report on PPI is released during the second or the third week of each month by the Bureau of Labor Statistics (BLS) and covers data regarding the preceding month. The Bureau publishes this report at 13:30 GMT (8:30 AM EST).
The PPI reveals trends within the wholesale markets, manufacturing industries and commodities markets. All of the physical goods-producing industries, which comprise the economy are included, with the exception of imports. The prices included in the PPI regard the first commercial transaction.
Since the producer price index reflects prices of consumer goods and capital equipment, a portion of the inflation at the producer level is usually passed through to the consumer price index (CPI).
While the PPI used to include just the ”physical goods industries” such as mining, manufacturing etc., many services-based industries have been brought into the index over time.
Three figures
The US PPI report shows three headline index figures, one for crude, one for intermediate and one for finished goods on the national level:
The PPI Commodity Index (crude) shows the average price change during the current month in comparison with the previous month for commodities, such as energy, coal, crude oil and the steel scrap.
The PPI Stage of Processing Index (SOP) (intermediate) represents goods, which have been manufactured at some level, but will be sold to other manufacturers in order to create the finished good. Examples of SOP products can be lumber, steel, cotton and diesel fuel.
The PPI Industry Index (finished) represents the final stage of manufacturing and is used as a source of the core PPI.
Most significant
![]() The core PPI figure is of greatest importance. It represents the finished goods index minus the volatile food and energy components. The PPI is meant to reflect only the prices that are being paid during the survey month. It is usual companies that do regular business with large customers to have long-term contract rates, which may be known at present, but not paid until a future date. The PPI excludes future values or contract rates.
The core PPI figure is of greatest importance. It represents the finished goods index minus the volatile food and energy components. The PPI is meant to reflect only the prices that are being paid during the survey month. It is usual companies that do regular business with large customers to have long-term contract rates, which may be known at present, but not paid until a future date. The PPI excludes future values or contract rates.
Similar to the CPI, the PPI also uses a base year during which a basket of goods was measured and the index had a value of 100. The PPI uses 1982 as a benchmark year. Every following year is compared to this base year.
How do traders read the Producer Price Index report?
Traders and analysts consider the PPI for finished goods as a precursor of consumer price inflation. In case the prices, which manufacturers pay for their raw materials, surge, producers would have to increase the prices, which consumers pay for their finished goods, in order to sustain their profit margins.
As the CPI is the indicator for inflation, traders will strive to get a sneak preview by examining the PPI report. The Federal Reserve also studies this report intently in order to clarify future policy moves, which might be needed to manage inflation.
 The PPI report does not directly affect currency pairs, but because it is released before the CPI report, it serves as a valuable tool to predict rate of inflation. Since inflation is a sign that the purchasing power of a nations currency is reducing and each unit of local currency purchases fewer goods and services, a rise in rate of inflation (well above the inflation target set by central banks) usually has a negative effect on a currency.
If a local currency becomes less valued because of inflationary pressure, the demand for that currency decreases. This is especially evident if the country in question imports a high amount of goods that are considered valuable and needful, from a country with low production costs. These goods appear to be more expensive as the local currency loses value against the exporting countrys currency, while the inflation rate rises as prices surge.
Example
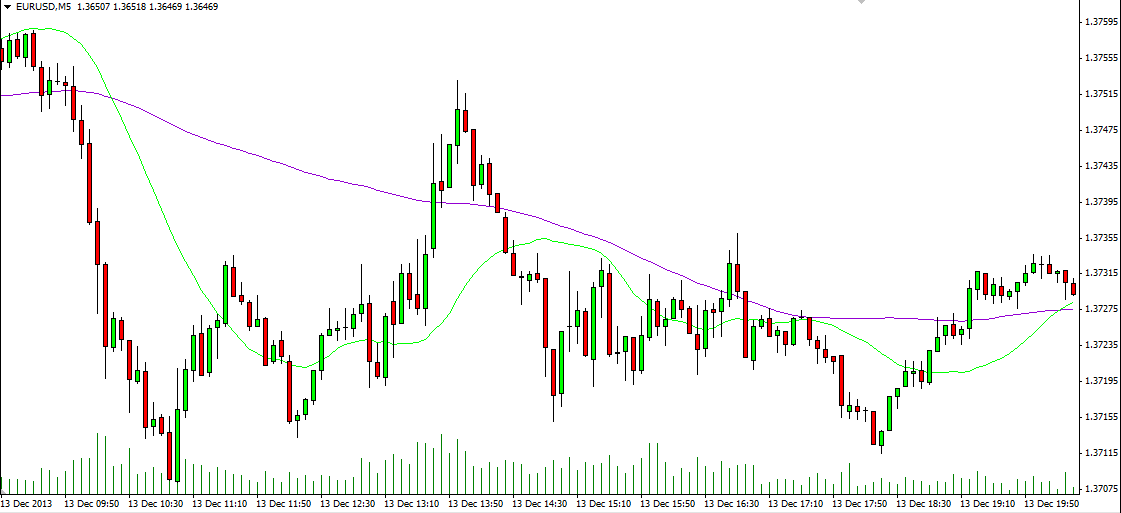
Source: MetaTrader 4 by MetaQuotes Software Corp.
The chart above visualizes how EUR/USD reacted to the release of the PPI report out of the United States at 13:30 GMT on December 13th. The annualized PPI rose to 0.7% in November, below forecasts of an advance to 0.8%, while the annualized core PPI ticked down to 1.3% in November from 1.4% in October. Experts had expected that the core PPI will remain steady in November. These data points triggered greenbacks retreat, with EUR/USD cross gaining some 15-20 pips. A possible explanation? As the annualized core PPI remained almost unchanged in November compared to October, this result hinted that the core CPI could probably either slow down, or remain unchanged as well.