MetaTrader 4 Technical Indicators Management
This lesson will cover the following- Modifying Indicators
- Copying Indicators
- Deleting Indicators
We have spoken a lot about technical indicators in our “Technical Forex Trading Indicators” guide so we will skip the details regarding each indicator and focus on managing them within the trading platform. This includes adding, copying, modifying, overlaying and deleting technical indicators within the MetaTrader 4 platform.
As we have already said when we looked through the different menus and toolbars of the MetaTrader 4 terminal, there are several ways to insert an indicator into the chart. You can click Insert >>> Indicators or you can press the ![]() in the Charts toolbar to open up a full list. You can also use the Navigator window to drag-and-drop indicators directly into the chart or to right-click on an indicator and execute the Attach to a chart command.
in the Charts toolbar to open up a full list. You can also use the Navigator window to drag-and-drop indicators directly into the chart or to right-click on an indicator and execute the Attach to a chart command.
Depending on the indicator, it can be either drawn on the chart itself (e.g. a moving average), or it can be plotted below the price action in the so-called Indicator Window. It is illustrated below.
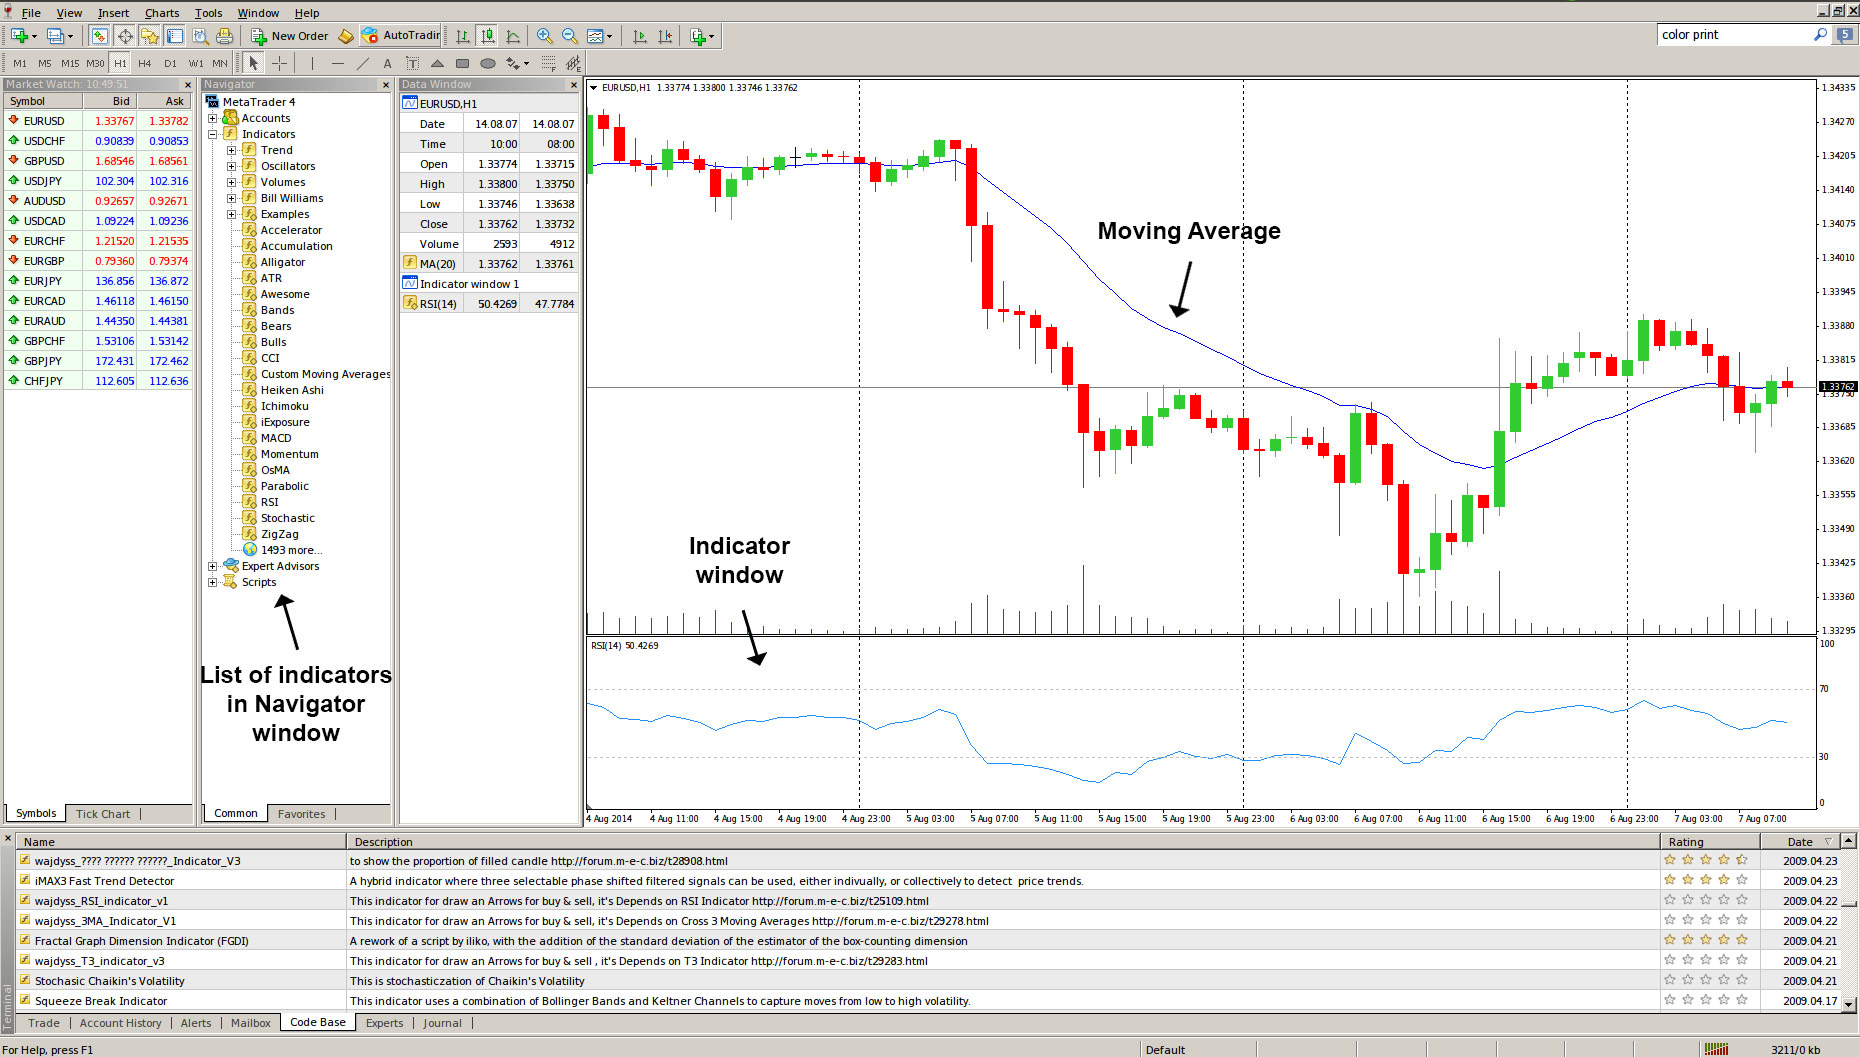
Apart from plotting an indicator based on price data and data derivatives (such as price close etc.), it can also be based on data from other indicator. For example, you can insert a moving average into the chart of some other indicator (e.g. Awesome Oscillator), and the MA will serve as a signal line. Traders tend to trade crossovers of an indicator and its signal line. This is done by dragging and dropping an indicator from the Navigator window into an already inserted indicator. As the Parameters menu pops up, you need to select the Previous Indicators Data option in the Apply to expanding menu. If you select the First Indicator Data option, the moving average will be based on the first indicator used, which can differ from the Awesome Osicllator.
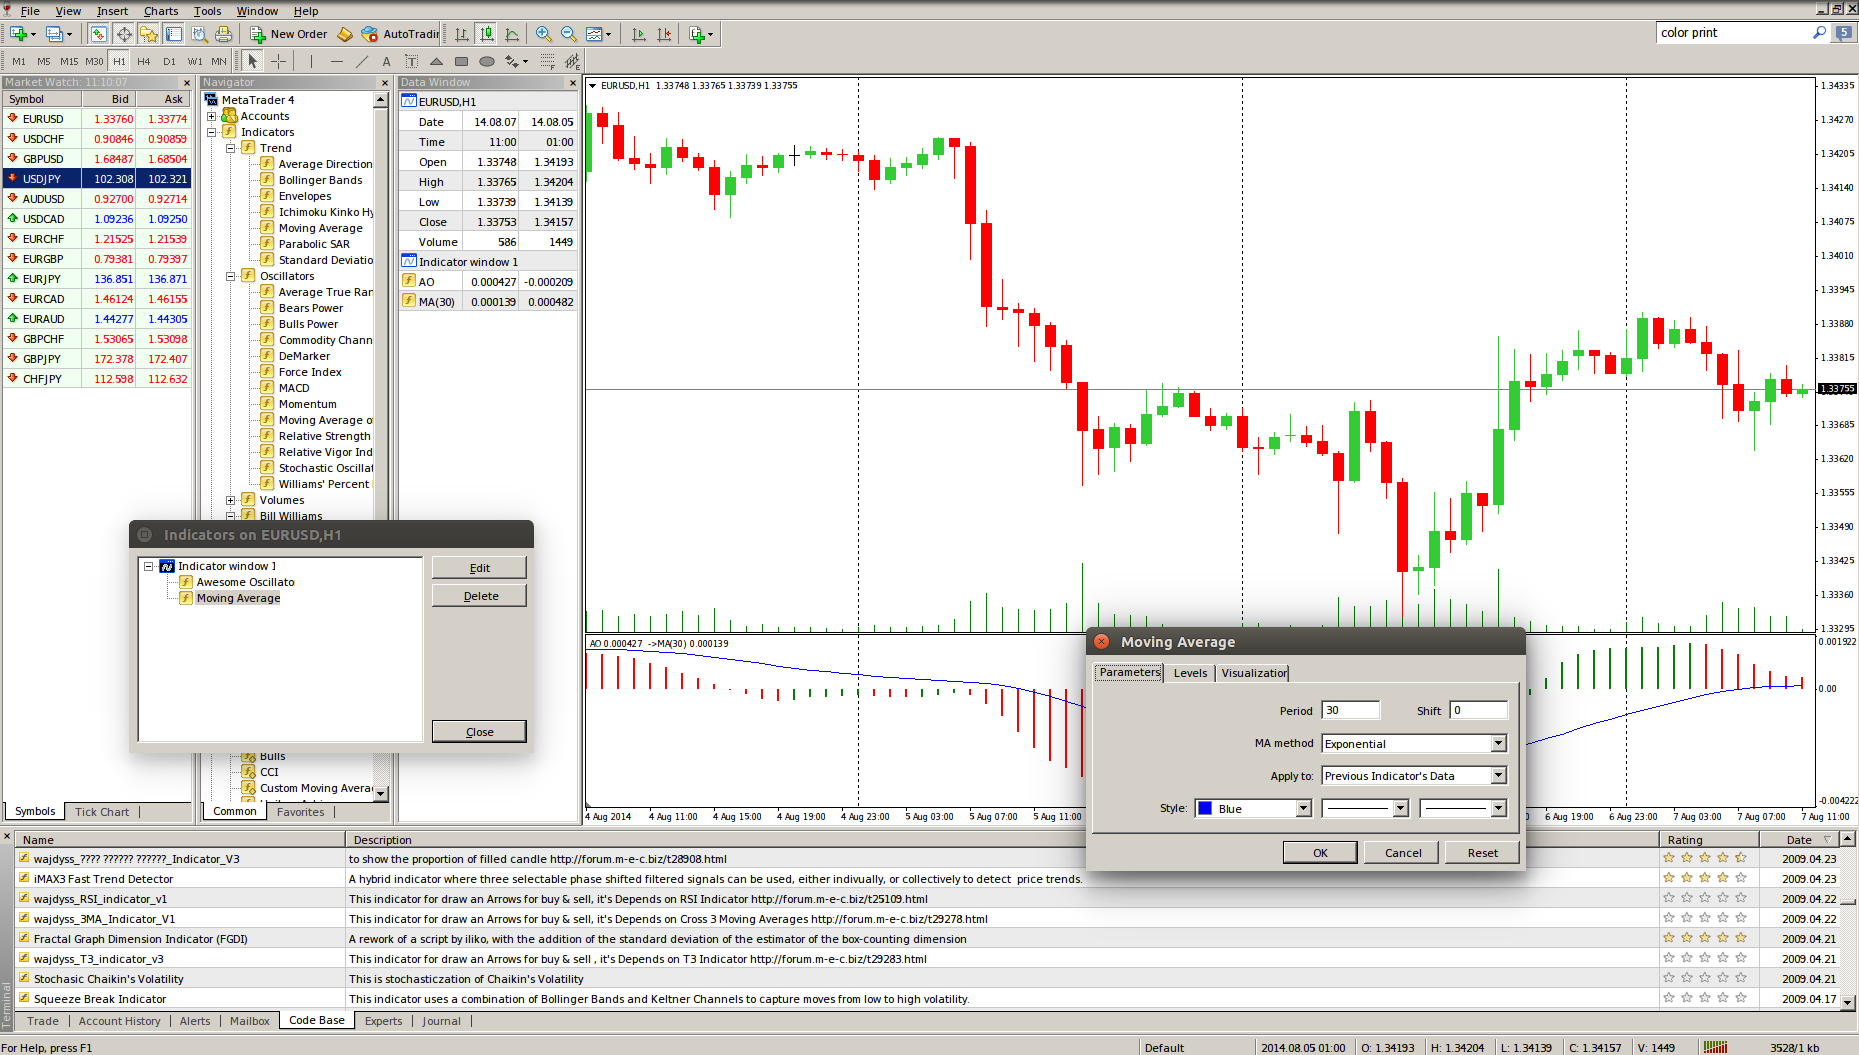
The Indicators List can be accessed by right-clicking on the chart and executing the command Indicators List, or by hitting the Ctrl+I hotkey combination. This window displays all the indicators that are currently active on the chart and allows to easily access each indicators settings menu. On the screenshot below you can see both the Indicators List window and a double-indicator overlay.
Modifying indicators
 Once you have added an indicator to the chart, you can alter each of its properties, as well as its colors, types and thickness of lines, and the size of its signs. You can access each indicators properties dialog in several ways:
– Double-click the left mouse button over the indicator visualization (line, histogram etc).
– Right-click over the indicators visualization and select Properties.
– Open up the Indicators List, select the indicator and press Edit.
Different indicators will have varying analytical properties and thus the tabs of their Properties dialog will also differ. However, there is a number of properties which are common to all indicators. They are:
– Colors and line styles;
– Visualization tab which contains the visualization modes of an indicator for each time frame. Checking or unchecking a time frame will determine whether the indicator will be displayed on a certain time frame or not.
Apart from the common settings, other properties, which however vary between the different types of indicators, are the indicators trackback period, overbought and oversold levels lines, smoothing method (for the moving averages), deviation (for banding indicators such as the Bollinger Bands), other custom-placed level lines etc.
Copying indicators
 Some indicators, just like line study tools and other graphical objects, can be copied. This is done by selecting the object from the chart, and then duplicating the object by holding Ctrl + Left Mouse click. Once the object has been copied, you can drag the copy to whatever position you desire.
Deleting indicators
 Deleting an indicator from the chart can also be done in several ways.
– First, you can right-click on the indicators visualization and select the Delete Indicator context menu command.
– Second, if the indicator is plotted in the Indicator window, you can right-click to open its context menu and execute the Delete Indicator Window command. This will remove the entire window, along with any indicator that it contains.
– Third, you can open up the Indicators list window and look up the entire list of active indicators. Each one can be selected individually and removed from the chart by hitting the Delete button.